Operations | Monitoring | ITSM | DevOps | Cloud

Go

How to use Tailscale for gRPC authentication in Golang

Friends of this blog know that I am a big fan of building internal tools, or as we call them, "tools that help scale people". As the name suggests, internal tools are used, well, internally and as such usually will require their access to be restricted to the company's staff and network. In the past, I've written about how to use Tailscale for authentication of internal tools using HTTP. In this post, I will show you how to use Tailscale for gRPC authentication in Golang.

How to use PGO and Grafana Pyroscope to optimize Go applications

Profile-guided optimization (PGO) is a compiler feature that uses runtime profiling data to optimize code. Now fully integrated in Go 1.21+, PGO is a powerful tool to boost application performance — and with Grafana Pyroscope, our open source continuous profiling database, you can significantly magnify the value of PGO. In this post, we’ll explore what PGO is, how the Pyroscope team has used it internally to improve performance, and how you can use PGO to make your own programs faster.

Patching Go's leaky HTTP clients

In November 2023 we discovered an issue in the Go standard library’s net/http.Client that allowed an attacker who controls redirect targets on a server to exfiltrate authentication secrets. Soon after, we discovered a similar issue in net/http/cookiejar.Jar. The issues, collectively designated CVE-2023-45289, have now been fixed in Go 1.22.1 and Go 1.21.8, released on March 5, 2024. This blog post dives into the technical details behind those two bugs and the patch that addresses them.

Go memory metrics demystified

For engineers in charge of supporting Go applications, diagnosing and resolving memory issues such as OOM kills or memory leaks can be a daunting task. Practical and easy-to-understand information about Go memory metrics is hard to come by, so it’s often challenging to reconcile your system metrics—such as process resident set size (RSS)—with the metrics provided by the old runtime.MemStats, with the newer runtime/metrics, or with profiling data.

Debugging Go compiler performance in a large codebase

As we’ve talked about before, our app is a monolith: all our backend code lives together and gets compiled into a single binary. One of the reasons I prefer monolithic architectures is that they make it much easier to focus on shipping features without having to spend much time thinking about where code should live and how to get all the data you need together quickly. However, I’m not going to claim there aren’t disadvantages too. One of those is compile times.

Deploying a Golang Microservice to Kubernetes

With the rise of cloud computing, containerization, and microservices architecture, developers are adopting new approaches to building and deploying applications that are more scalable and resilient. Microservices architecture, in particular, has gained significant popularity due to its ability to break down monolithic applications into smaller, independent services.

Unlocking Open Telemetry for Golang

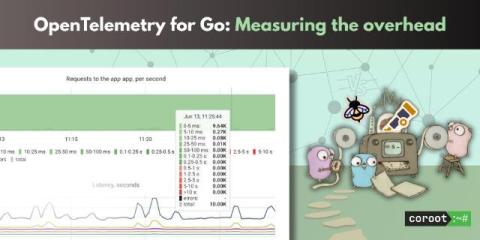
Open Telemetry (OTel) is an open source observability framework that has garnered significant attention for its powerful capabilities in monitoring metrics, logs and traces.. It is second only to Kubernetes in the CNCF velocity chart with contributions being made from major players in the cloud industry, and has a growing community helping build out a thriving ecosystem.