Operations | Monitoring | ITSM | DevOps | Cloud

APM

The latest News and Information on Application Performance Monitoring and related technologies.

Best practices for writing clean, maintainable JavaScript

The world’s biggest language comes with a huge collection of conventions and guidelines from the community’s collective wisdom. Following JavaScript best practices can help achieve faster page loads and better performance, improve code readability, and make maintenance and debugging easier. Carefully crafted code can also prevent errors and security issues, especially if it’s complemented with real-time diagnostic tools such as JavaScript error monitoring.

Chasing the Rainbow: Towards Unified Service Metrics

As Zendesk migrated from a monolithic application to an ecosystem of hundreds of services, its need for fully unified and standardized observability became a chief concern. In this talk, Senior Principal Engineer Daniel Schierbeck shares how adopting a service mesh has helped Zendesk teams manage its growing number of services while standardizing its observability. He also explains how Zendesk’s approach to monitoring service interactions has evolved as it adopted Datadog metrics and Datadog APM.

OpenTelemetry Java Tutorial | Auto-Instrument Java App with OpenTelemetry

OpenTelemetry stands at the forefront of modern observability practices, revolutionizing how developers gain insights into their applications' performance and behavior. As a powerful distributed tracing framework, it empowers engineers to effortlessly instrument their applications, providing comprehensive visibility into the intricacies of microservices architectures. This tutorial discusses how OpenTelemetry can be used to get insights from a Java application.

OpenTelemetry Operator Complete Guide [OTel Collector + Auto-Instrumentation Demo]

Manually deploying and managing OpenTelemetry components in a Kubernetes environment can be a complex and time-consuming task. It involves creating various Kubernetes resources, setting up configurations, and ensuring the components are properly integrated with the applications.

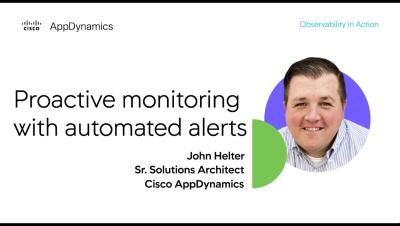
Proactive monitoring with automated alerts

E-commerce DevOps teams can use AppDynamics to monitor the health and performance of their applications, receiving alerts on issues BEFORE significant business impact. Devs can use AppDynamics to provide automatic email and text notifications about such issues. In this demo, see how you can harness a custom email alert notification to view anomalous synthetic transaction events within the Browser App Dashboard, drill into the Heath Rules violation page, and link to a custom dashboard to troubleshoot an unexpected increase in synthetic end-user response time for shopping cart activity.

OpenTelemetry Webinars - The Open Agent Management Protocol

Open Agent Management Protocol (OpAMP) is the emerging open standard to manage a fleet of telemetry agents at scale. Join Nica and Srikanth as we discuss recent updates to the standard and how you can remotely manage the OpenTelemetry collector with OpAMP. SigNoz helps developers monitor applications and troubleshoot problems in their deployed applications. SigNoz uses distributed tracing to gain visibility into your software stack.

OpenTelemetry Webinars - The Trace API

Join Nica and Srikanth to talk in detail about the OpenTelemetry Trace API. We'll talk about adding spans, events, attributes and other extra info, whether it's really possible to replace logs with traces, and more More about SigNoz: SigNoz - Monitor your applications and troubleshoot problems in your deployed applications, an open-source alternative to DataDog, New Relic, etc. Backed by Y Combinator.