Operations | Monitoring | ITSM | DevOps | Cloud

SCOM

The latest News and Information on Service Center Operations Manager and related technologies.

How to get complete CI/CD pipeline observability

It's not like it used to be back in the day! Before CI/CD, we were building on-premises, service-oriented products following system style architecture and we were able to map out the build system and end-to-end process in a PowerPoint or Visio document. Although time-consuming and inefficient, it was relatively straightforward and the build pipeline was unlikely to change drastically. But that's no longer the case.

GripMatix and SquaredUp join forces

We know there are a couple of dashboard solutions for which integration with SCOM can or could be created. However none of them integrates better and more easily than SquaredUp Dashboard Server for SCOM. It integrates with the SCOM platform out-of-the-box, leverages the SCOM object model to the fullest and is very easy to create dashboards with. For most use cases you do not even have to create dashboards, as the product comes with many out-of-the-box community dashboard packs.

Software Project Managers: get total visibility of all your tools

Project managing global software projects is always a challenge, contending with multiple time zones, tools, and teams. In these environments, the day-to-day life of a Project Manager is filled with status collections, project reporting, and little time for much else. While the detail will always matter – like team bug data, feature status, and build progress – there is a better way than collecting and reporting on all this data manually. Does this scenario sound familiar?

Status dashboards: Get visibility across teams and services all in one view

Applications are built and run by many people and made of many components: infrastructure, code pipelines and end users to name a few. Understanding the status of those components and teams is never straight forward. In this blog, we will be unpacking the problem faced by most organizations and taking a look at how SquaredUp can empower you and your organization with status visibility across different teams / components / services – all in one view.

NiCE Active 365 Management Pack 4.1 released

Microsoft 365 services help companies worldwide improve business and revenue by providing best in class digital workspace experience. The NiCE Active 365 Management Pack complements this by advanced M365 monitoring such as full Teams Call analysis integrated into Microsoft SCOM. Advanced monitoring and analytics help you reveal unwanted micro-events influencing the health and performance of the system and its users.

Kubernetes Management Pack for SCOM Released by OpsLogix

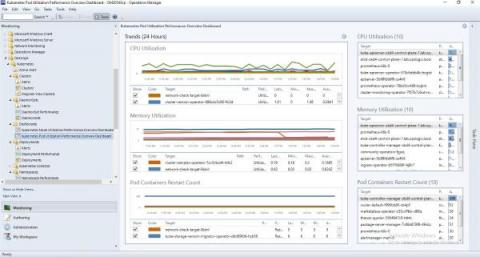
OpsLogix is excited to announce the initial release of our new product, the Kubernetes Management Pack for SCOM. This product provides comprehensive monitoring for Kubernetes clusters and gives SCOM administrators a single pane of glass from which to monitor all their Kubernetes resources. With this management pack, you can be sure that your Kubernetes environment is always running smoothly and efficiently!

OpsLogix SCOM Connector for Microsoft Teams: Major New Updates Released!

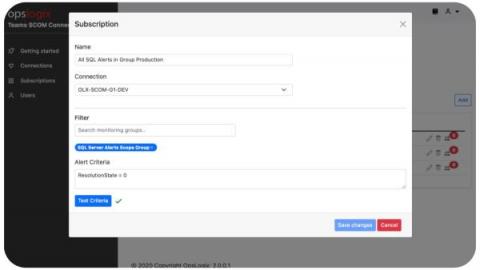
Since the release of our SCOM Connector for Microsoft Teams, we've been blown away by the positive feedback and uptake from customers. The connector has allowed businesses to connect their Operations Manager environment with Microsoft Teams, giving them a single pane of glass view and anywhere access to their IT operations. We're happy to announce that we've just released a new version of the connector, which introduces some significant updates to the functionality!

3 reasons why reporting SLOs at scale is hard

I figure you’re doing okay with SquaredUp. It still works for you. Maybe you feel there are a couple of things that could be improved, but it’s not a big deal. So you’ve not upgraded yet. And frankly, because it all works fine and is still doing its job, you haven’t kept up to date on all the latest features rolled out in the SquaredUp updates. But…you’re missing out – on a lot.

How to get One-click SCOM Root Cause Analysis

SCOM has incredible powers, but it’s not always easy to find the root cause of issues fast. And you definitely don’t get one-click SCOM root cause analysis. We’ve all been there. A business-critical server goes down and you don’t know why. Let’s imagine you had a dashboard showing the health statuses of all your server groups and you notice that the United States is showing as critical.

How to build a dashboard for AppDynamics

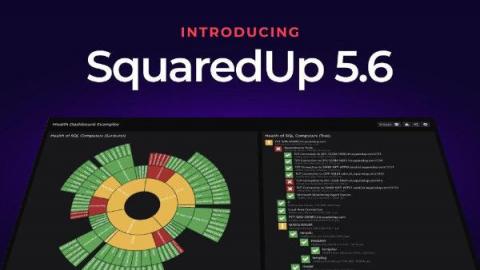
We’re excited to announce that we’ve just released SquaredUp Dashboard Server 5.6! This Dashboard Server release covers multiple features that have been highly requested by the community. Prioritizing this user feedback, we’ve added some exciting new visualizations, features and enhancements. Read on to learn about the latest updates, or catch the full webinar recording at the bottom of the blog for a detailed demo by Senior Solutions Engineer Ashley Thompson.