You may get lucky this holiday season with a new 3D printer, either as a gift or something you give yourself as a reward for all your hard work this year. Household 3D printers have made tremendous strides in ease of use and affordability over the last decade.
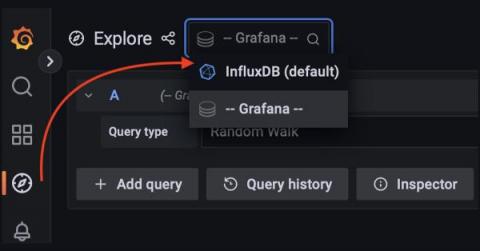
At some point if you’re working with data, you’ll probably want to be able to visualize it with different types of charts and organize those charts with dashboards. You’ll also need somewhere to store that data so it can be queried efficiently. One of the most popular combinations for storing and visualizing time series data is Grafana and InfluxDB.
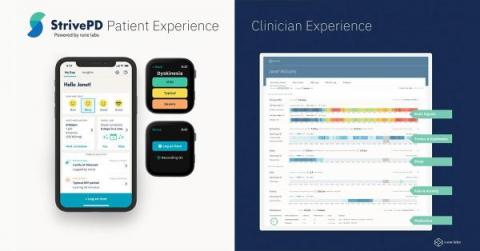
I recently chatted with one of our InfluxDB Cloud customers, Rune Labs, to discuss how they’re using this purpose-built time series platform. Every customer has a unique story — I love sharing their stories as well as their Telegraf, InfluxDB, and Flux tips and tricks. Keep reading to learn about Rune Labs’ approach to precision neurology, and learn from Engineering Manager Carolyn Ranti how they are using InfluxDB to collect sensor data.
Log files and system logs have been a treasure trove of information for administrators and developers for decades. But with more moving parts and ever more options on where to run modern cloud applications, keeping an eye on logs and troubleshooting problems have become increasingly difficult.
Dear Santa, I’ve been an extremely good IT Operations Manager this year (which is saying something considering the state of the world at the moment) and I have a few items on my wish list.
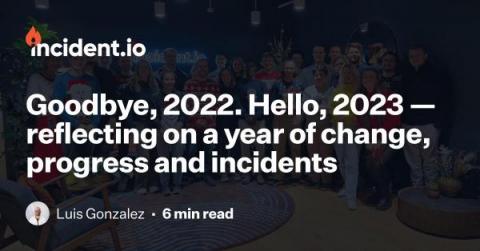
Let’s get one thing out of the way: we’re going into 2023 on a high-note. We’ve closed deals with some of the most respected companies in both the UK and US, we’ve hired in the double-digits, expanded into New York, and revenue is growing steadily. But we aren’t hanging up our football boots just yet. Yes, we can take some time to celebrate our wins, but we’re all hands on deck for 2023 planning.