Operations | Monitoring | ITSM | DevOps | Cloud

IoT

Adding Devices to Neurons for IIoT

Watch full video here. Hear about Android Enterprise and how to add devices from a template to IIoT. Wavelink Wednesday's will be held on the third Wednesday of every month. Join us as we will dive into technical topics with our product experts to help you get the most from your mobile enterprise deployments. We will deliver tips, tricks, best practices, and tools to help you on your journey to operational excellence.

Top tips: 4 innovative ways IoT today can keep the doctor away

Top tips is a weekly column where we highlight what’s trending in the tech world and list ways to explore these trends. This week we’re looking at four revolutionary ways IoT is transforming healthcare. The past four years have brought about a series of unprecedented events that challenged our worldview, our lifestyle, and most importantly, how we view healthcare.

How To Use AUTOSAR Runnables With Tracealyzer

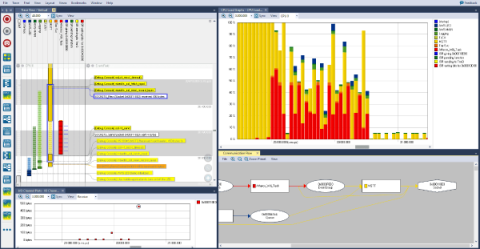
Tracing of “runnables” is a fairly new feature in Percepio Tracealyzer, added in v4.7.0. One of our automotive customers needed this feature to make ISO 26262 certification of their Electronic Control Unit (ECU) software easier. In order to properly allocate ECU functions to tasks and to cores, and to ensure that they meet the budgeted resources, it is useful to know execution times, response times and wait times for each task and runnable.

Accelerate development and optimize in-field device quality with remote debugging and monitoring

Ensuring high product quality & reliability extends beyond lab testing. Field conditions and ever-changing device ecosystems require continual adjustments for seamless connectivity, optimal battery life, and sustained interoperability. A robust pipeline to capture, analyze, and alert on device reliability data is critical to maximize yield, optimize performance, and stay ahead of problems that emerge in the field.

Technology That Will Enhance Your Business

In this rapidly progressing digital era, businesses must embrace innovative technologies to stay competitive. The right blend of technological tools streamlines operations and opens up new avenues for growth and profitability. To arm you with the knowledge necessary for businesses embracing technology, we have compiled this helpful post about some of the most impactful technological advances that will enhance your business operations.

Tracealyzer 4.8.2 Is Out

Tracealyzer version 4.8.2 has just been released. This version mainly fixes bugs, such as custom state machine models not being remembered on trace reload, and eliminates a number of compiler warnings in the Recorder source code. In addition, the update features improved streaming over UDP, and the bundled SSH library SSH.NET has been updated to the latest version. Users with a current maintenance contract can upgrade to Tracealyzer 4.8.2 from within the application, or by visiting the update page.

How Embedded Device Observability Helps Latch Build Ultra-Reliable Products

Embedded developers have historically found it difficult to obtain high-quality data on the performance and health of their devices once deployed in the field. They've had to rely on customer reports and navigate through complex and time-consuming processes to effectively address any issues that arise. For companies like Latch, who care deeply about product reliability and quality, this isn’t good enough. Find out how they use Memfault to collect high-quality debugging and performance data from their devices in the field and use it to ensure their customers get the best possible product.

DevAlert 2.0 Now Available

DevAlert 2.0, which is now immediately available from Percepio, is a major upgrade to our edge observability platform. The upgrade provides much improved diagnostic capabilities, including core dumps for Arm Cortex-M devices. This allows remote inspection of crashes, errors or security anomalies in full detail, including the function call stack, parameters and variables and with source code display.

Diving into JTAG - Overview (Part 1)

As the first segment of a three-part series on JTAG, this post will give an overview of JTAG to set up some more in-depth discussions on debugging and JTAG Boundary-Scan. We will dive into the intricacies of the interface, such as the Test Access Port (TAP), key registers, instructions, and JTAG’s finite state machine. Like Interrupt? Subscribe to get our latest posts straight to your inbox.