Operations | Monitoring | ITSM | DevOps | Cloud
February 2022
Revisiting The Things Network: Connecting The Things Network V3 to InfluxDB
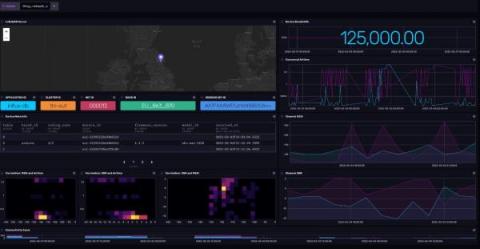
Back in 2019, David Simmons created an awesome blog introducing LoRaWAN devices and The Things Network. He also showed you how easy it was to connect The Things Network V2 to InfluxDB. Since then, a few things have changed and I thought it was time to revisit the Things Network with a new project.
IoT Security: How Important are Logs for System?
IoT has rapidly moved from a fringe technology to a mainstream collection of techniques, protocols, and applications that better enable you to support and monitor a highly distributed, complex system. One of the most critical challenges to overcome is processing an ever-growing stream of analytics data, from IoT security data to business insights, coming from each device. Many protocols have been implemented for this, but could logs provide a powerful option for IoT data and IoT monitoring?
InfluxData Announces New Customers and Accelerated Momentum in Industrial Data and Internet of Things
InfluxData today announced accelerated momentum in Industrial Data and Internet of Things (IoT) driven by new customers, product enhancements and expanded industrial partnerships fueled by the growth of time series data. Customers including Tesla, Rolls Royce, Airbus, Teck, Graco and Graphite Energy are using InfluxDB to collect industrial data from devices and sensors.
Graphite Energy Uses Time Series Data to Drive Industrial Decarbonization Efforts
One major challenge with decarbonization of industrial heat is converting the variability of renewable energy into the reliability required by process plants. Solar panels only generate energy when the sun is out, and wind turbines generate energy when the wind blows. Industry, however, has a consistent and persistent need for energy. Graphite Energy, based in Australia, recognized this disconnect and set out to create a solution to it.
A Platform Gaining Momentum: Announcing New InfluxDB Features for Industrial IoT
Data – specifically time series data – continues to be the key ingredient for successful digital transformation. No matter the industry, time series data helps companies understand the activities and output of people, processes and technologies impacting their business. The effective management and use of time series data has emerged as the best path towards this goal.
Low latency Linux kernel for industrial embedded systems - Part III
Welcome to the concluding chapter of this three-part blog series on the low latency Ubuntu kernel for industrial embedded systems. Each blog is standalone and can be read independently from the others, although you may want to start at the beginning for some continuity. If you need a quick refresher on userland and kernel space, we recommend you check Part I out first.
Low latency Linux kernel for industrial embedded systems - Part II
Welcome to Part II of this three-part blog series on adopting the low latency Ubuntu kernel for your embedded systems. In case you missed it, check out Part I for a brief intro on preemptable processes in multiuser systems and memory split into kernel and user space. The low-latency Ubuntu kernel ships with a 1000 Hz tick timer granularity (CONFIG_HZ_1000) and the maximum preemption (CONFIG_PREEMPT) available in the mainline Linux kernel.
Low latency Linux for industrial embedded systems - Part I
Welcome to this mini blog series on the low latency Linux kernel for industrial embedded systems! The real-time patch, which is not fully upstream yet, has had many developers wonder about stable alternatives for their projects adopting an embedded Linux operating system (OS) with latency requirements in the milliseconds’ range. The low-latency Ubuntu Linux kernel from Canonical is less costly to maintain than real-time alternatives.
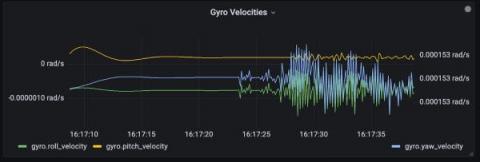
Real-time drone tracking and management with Grafana
The number of internet-connected assets around us that are powering services and utilities in a wide array of sectors is rising at an exponential rate. As a result, it’s becoming critical for businesses that provide such services and utilities to have an observability stack tailored to the type of physical hardware devices that are generally deployed in swarms.
Percepio Releases Tracealyzer 4.6 with Improved Zephyr and ThreadX Support
Percepio®, the leader in visual trace diagnostics for embedded systems and the Internet of Things (IoT), today released Tracealyzer 4.6 with official support for Zephyr RTOS and Microsoft Azure RTOS ThreadX. The new release also includes Percepio’s next generation trace recorder library with improved support for snapshot trace.
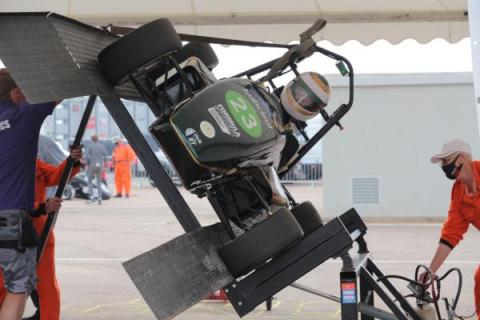
Tracing on the Race Track
Today is test day at Curborough Sprint Track, and the University of Nottingham’s Race Team is taking its creation out for a spin. Frankie is their fully electric 2WD vehicle, able to achieve speeds of up to 80mph (129 km/h). The Team uses Tracealyzer to test the functionality of their embedded software; while writing the code, to record the trace while Frankie is running, and to review the data afterwards. And with great results.
Design Considerations for Software Distribution to Edge & IoT Applications
What we've been reading in January
Here are the articles, videos, and tools that we’ve been excited about this January. We hope you enjoy these links, and we look forward to hearing what you’ve been reading in the comments or on the Interrupt Slack.


