Visualizing Time Series Data with Chart.js and InfluxDB
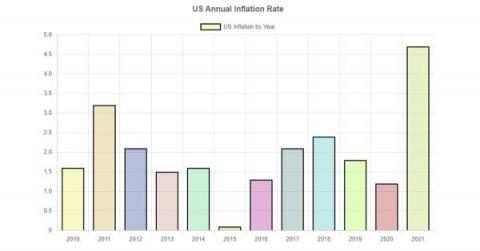
Time series data is a sequence of data points generated through repeated measurements indexed over time. The data points originate from the same source and track changes at different points in time. Times series data includes data like stock exchange data, monthly inflation data, quarterly gross domestic product (GDP) data, and logs from IoT sensors.


