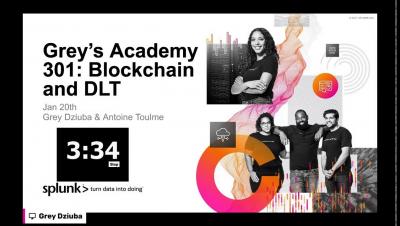
Grey's Academy 301: Blockchain, DLT and Splunk
Join us to find out how Splunk works with Blockchain and Distributed Ledgers.


The latest News and Information on Log Management, Log Analytics and related technologies.
In the last few years, many organizations I worked with have significantly increased their cloud footprint. I’ve also seen a large percentage of newly launched companies go with cloud services almost exclusively, limiting their on-premises infrastructure to what cannot be done in the cloud — things like WiFi access points in offices or point of sale (POS) hardware for physical stores.
Thomas Stringer has a couple of great blog posts on how to understand your Azure monitoring costs and also on how to reduce your costs, see Azure Monitor Log Analytics too Expensive? Part 2 – Save Some Money | Thomas Stringer (trstringer.com). In the past I’ve blogged on How to calculate the Azure Monitor and Log Analytics costs associated with AVD (not an easy task!).
I’ve been contributing to, and creating, Splunk apps for the better part of the last 10 years. But never have I felt more excited to be a Splunk Developer than right now. One of the primary reasons why I am so excited is because of build tools like @splunk/create. At Splunk, we recognize that developers are so crucial to our entire ecosystem.
The massive shift to remote work makes managing endpoint security more critical and challenging. Yes, people were already using their own devices for work. However, the rise in phishing attacks during the COVID pandemic shows that all endpoint devices are at a higher risk than before. Plus, more companies are moving toward zero-trust security models. For a successful implementation, you need to secure your endpoints.
Security is one of the most changeable landscapes in technology at the moment. With innovations, come new threats, and it seems like every week brings news of a major organization succumbing to a cyber attack. We’re seeing innovations like AI-driven threat detection and zero-trust networking continuing to be a huge area of investment. However, security should never be treated as a single plane.
Hybrid and multi-cloud environments produce a boundless array of logs including application and server logs, logs related to cloud services, APIs, orchestrators, gateways and just about anything else running in the environment. Due to this high volume, logging systems may become slow and unmanageable when you urgently need them to troubleshoot an issue, and even harder to use them to get insights.
Health data is notoriously difficult to collect, route, and transform. I will demonstrate how to leverage the LogStream Observability Pipeline to solve these problems and help users search their Apple Health data.
With dozens of microservices running on multiple production regions, getting to a point where any error log can be immediately identified and resolved feels like a distant dream. As an observability company, we at Coralogix are pedantic when it comes to any issue in one of our environments. That’s why we are using an internal Coralogix account to monitor our development and production environments.