Microservices testing is an essential part of any DevOps strategy. In a fast-paced environment like DevOps, you need real-time data on the deployment status and ensure your microservices integrations work correctly. The best way to achieve this is with frequent microservices testing.

As a Senior Product Manager at Mezmo, I understand the challenges businesses face in managing data complexity and the higher costs that come with it. The explosion of data in the digital age has made it difficult for IT operations teams to control this data and deliver it across teams to serve a range of use cases, from troubleshooting issues in development to responding quickly to security threats and beyond.
As an e-commerce website owner you care about how your customers behave: why do they come to your website, which items or services are they most interested in, how much time do they spend on certain pages, and is their user experience above par? Also, it is very important to keep your website secure, as you can rest assured that no one wants to leave their payment details on an unsecured website.
Modern computing environments and distributed workforces have produced new challenges to traditional information security approaches. Many traditional threat detection and response strategies rely on homogeneous environments, system baselines, and consistent control implementations. These strategies have been built on traditional environment assumptions that may no longer be true in your environment with the evolution of cloud computing, remote work, and modern culture.
Elastic has an entirely new Heartbeat/Synthetics workflow superior to the current workflow. If you’re a current user of the Elastic Uptime app, read on to learn about the improved workflow you can use today and should eventually migrate toward.
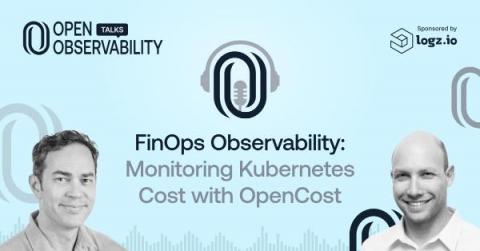
With the current financial climate, cost reduction is top of mind for everyone. IT is one of the biggest cost centers in organizations, and understanding what drives those costs is critical. Many simply don’t understand the cost of their Kubernetes workloads, or even have observability into basic units of cost. This is where FinOps comes into play, and organizations are beginning to implement those best practice standards to understand their cost.
In today's digital landscape, organizations rely on software applications to meet the demands of their customers. To ensure the performance and reliability of these applications, observability pipelines play a crucial role. These pipelines gather, process, and analyze real-time data on software system behavior, helping organizations detect and solve issues before they become more significant problems. The result is a data-driven decision-making process that provides a competitive edge.
Cloudwatch is the de facto method of consuming logs and metrics from your AWS infrastructure. The problem is, it is not the de facto method of capturing metrics for your applications. This creates two places where observability is stored, and can make it difficult to understand the true state of your system. That’s why it has become common to unify all data into one place, and Prometheus offers an open-source, vendor-agnostic solution to that problem.
Simplified analysis. Enhanced visualizations, alerting capabilities, advanced data forwarding, and more. Great news! We have published a new update with many exciting new features and optimizations.
You can now use the Cloud Logging datasource plugin to view your logs in Grafana.
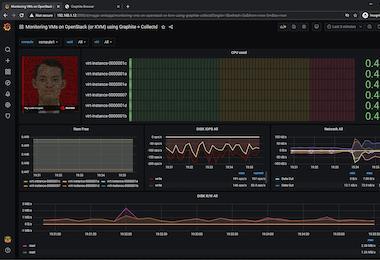
Graphite provides time-series metrics in an open-source database. With Graphite dashboards, you can see key performance indicators (KPIs) as well as other metrics visually. Dashboards typically display data as graphs, charts, and tables and can be customized to meet the specific needs of an organization. Using dashboards, organizations can monitor and analyze various aspects of their performance, such as system utilization, application performance, and resource utilization, using web interfaces.
When you’re adding or subtracting fractions, you need to make sure that they have a common denominator, a number that allows you to compare values. In the same way, your IT environment needs a common “language” for your event log data. Your environment consists of various devices running different operating systems, software, and firmware.
The ability to continue business operations for the foreseeable future is a key metric from a financial standpoint. But from a risk management perspective, all dimensions of an organization’s strategic and operational framework must be analyzed in order to… The last part relates to business resilience — and it’s what we’re going to explore here. (This article was written by Joseph Nduhiu. See more of Joseph’s contributions to Splunk Learn.)
Today, businesses are generating more data than ever before. However, with this data explosion comes a new set of challenges, including increased complexity, higher costs, and difficulty extracting value. With this in mind, how can organizations effectively manage this data to extract value and solve the challenges of the modern data stack?
Apache is the second most popular web server, after …., with its roots and official release going back as far as 1995. Throughout the years, it gained features, including HTTP/2, caching, and many more, while retaining its most appreciated capabilities: speed, modularity, and great stability. To fully leverage its features, you need to understand the environment, bottlenecks, traffic and user behavior. Just like with every software inside your infrastructure, Apache is no different.
The MongoDB document-oriented database is one of the most popular database tools available today. Developed as an open-source project, MongoDB is highly scalable and can be set up in your environment in just a few simple steps. When running and managing databases, monitoring is a key requirement.
OpenSearch dashboards are a powerful tool for visualising and exploring data stored in an OpenSearch-compatible data store such as Elasticsearch. With OpenSearch's intuitive interface and advanced analytical tools, this visualisation tool makes it easy to gain insights into your data and monitor and alert upon key metrics. Throughout this article, we'll look at some of the most impressive OpenSearch dashboard examples that showcase it’s capabilities and versatility.
This post was originally published on the Tracetest blog. Want to run trace-based tests with Elastic APM? Today is your lucky day. We're happy to announce that Tracetest now integrates with Elastic Observability APM. Check out this hands-on example of how Tracetest works with Elastic Observability APM and OpenTelemetry! Tracetest is a CNCF project aiming to provide a solution for deep integration and system testing by leveraging the rich data in distributed system traces.
In modern observability, Lucene is the most commonly used language for log analysis. Lucene has earned its place as a query language. Still, as the industry demands change and the challenge of observability grows more difficult, Lucene’s limitations become more obvious.
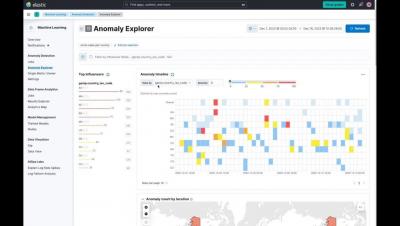
Artificial Intelligence (AI) - or more specifically Machine Learning (ML) - and automation were big topics for many of our customers in 2022. Common reasons for the interest in AI and automation were to: increase efficiency, reduce manual processing, minimise human error and - especially for the use of ML - identify ‘unknown unknowns’.
Several tech giants like Amazon and Netflix have jumped from their monolithic applications to microservices. This has allowed them to expand their business interface tremendously and improve their services. Not only them, but most businesses today are dependent on microservices. Twitter currently has about a thousand such services working together, releasing meaningful outputs.
Over the past decade, Prometheus has become the most prominent open source monitoring tool in the world, allowing users to quickly and easily collect metrics on their systems and help identify issues in their cloud infrastructure and applications. Prometheus was originally developed by SoundCloud when the company felt their metrics and monitoring solutions weren’t meeting their needs.
Logs are imperative for troubleshooting, performance analysis, health monitoring, and application integrity and security. Log management tools clearly understand how users interact with apps and systems and provide insight into improving software reliability, increasing productivity, reducing risks, and ultimately improving the user experience. Through log management tools, users can further integrate and enrich all of their logs, making queries quicker and more effective.
When thinking about holistic end-to-end observability, it can help to start with what you already have. Many government agencies are already strategically ingesting and storing logs — a key component of observability. More than a year and a half after the release of M-21-31, US government agencies continue to work through the logging maturity models outlined in the memorandum.
We are using data wrong. In today’s data-driven world, we have learned to store data. Our data storage capabilities have grown exponentially over the decades, and everyone can now store petabytes of data. Let’s all collectively pat ourselves on the back. We have won the war on storing data! Congratulations!
Flaky tests are a problem that are found in almost every codebase. By definition, a flaky test is a test that both succeeds and fails without any changes to the code. For example, a flaky test may pass when someone runs it locally, but then fails on continuous integration (CI). Another example is that a flaky test may pass on CI, but when someone pushes a commit that hasn’t touched anything related to the flaky test, the test then fails.
User experience is key to ensuring the success of your website. There are many metrics that help you gauge and improve it, but Core Web Vitals are probably the most important ones. They are a set of real-world, user-centered metrics that quantify key aspects of the user experience. By measuring dimensions of web usability such as load time, interactivity, and the stability of content as it loads, Core Web Vitals help you understand how your website is doing in terms of performance.
The Internet of Things (IoT) revolution has set the beginning of a new age of data transfer. Each day, a massive number of new devices get added to all kinds of network infrastructures, transferring gargantuan amounts of data back and forth. In the next decade, we expect the number of IoTs to grow to a staggering 80 billion connected devices – practically outnumbering the human population tenfold.
In data management, numerous roles rely on and regularly use telemetry data. The security engineer is one of these roles. Security engineers are the vigilant sentries, working diligently to identify and address vulnerabilities in the software applications and systems we use and enjoy today. Whether it’s by building an entirely new system or applying current best practices to enhance an existing one, security engineers ensure that your systems and data are always protected.
When an IT or Security issue impacts a development team’s software how are they notified? Is your organization still relying on mass emails that lack context and most engineers have probably already filtered out of their inbox? Communicating between siloed tools and teams can be difficult. How would you like to put IT, Security, legacy processes, and business notifications specific to development teams right into one of their most important tools? Now you can!
Kubernetes has come a long way, but the current state of Kubernetes open source monitoring is in need of improvement. This is in part due to the issues related to an unnecessary volume of data related to that monitoring. For example, a 3-node Kubernetes cluster with Prometheus will ship around 40,000 active series by default. Do we really need all that data?
OpenTelemetry is an open-source observability framework that provides a vendor-neutral and language-agnostic way to collect and analyze telemetry data. This tutorial will show you how to integrate OpenTelemetry with Amazon AWS Fargate, a container orchestration service that allows you to run and scale containerized applications without managing the underlying infrastructure.
With more and more applications moving to the cloud, an increasing amount of telemetry data (logs, metrics, traces) is being collected, which can help improve application performance, operational efficiencies, and business KPIs. However, analyzing this data is extremely tedious and time consuming given the tremendous amounts of data being generated. Traditional methods of alerting and simple pattern matching (visual or simple searching etc) are not sufficient for IT Operations teams and SREs.
Yes, it’s that time of year again. As the New Year’s resolutions fade and the planning cycles kick-in, technical leaders in various organisations are often asked to get out the crystal ball to inspire our teams or steer an excited Board.
Today executives and customers expect IT and digital services to be available and performant at all times; compromised availability or performance is no longer tolerable. Think about it; when was the last time a digital service was unavailable and it didn’t make the news or social media? When was the last time you visited a website that was unavailable and you waited for the outage to be over, rather than finding an alternative in the moment?
Historically, software development and SRE have worked in silos with different cultural perspectives and priorities. The goal of DevOps is to establish common and complementary practices across software development and operations. Sadly, in some organizations true collaboration is rare and we still have a way to go to build effective DevOps partnerships.
Apache Tomcat is the Java web server that implements many Java features like web site APIs, Java server pages, Java Servlets, etc. It’s an open-source software widely used in the industry. Tomcat sits on top of your application and is the entry point for reaching your application code. It is crucial to monitor its performance and make sure everything works, get notified when unexpected errors occur, and take action in real-time.
Log management tools improve security, help troubleshoot issues, and enable system monitoring. This log management guide defines key terms and explains the benefits of centralized tools.

Google Cloud Ops Agent now supports monitoring GCE instances with Prometheus.