
If you think log files are only necessary for satisfying audit and compliance requirements, or to help software engineers debug issues during development, you’re certainly not alone. Although log files may not sound like the most engaging or valuable assets, for many organizations, they are an untapped reservoir of insights that can offer significant benefits to your business.
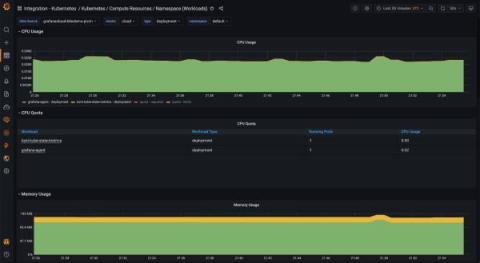
Back in May, we announced the Kubernetes integration to help users easily monitor and alert on core Kubernetes cluster metrics using the Grafana Agent, our lightweight observability data collector optimized for sending metric, log, and trace data to Grafana Cloud. The integration allows Grafana Cloud users to monitor and alert on Kubernetes cluster metrics. Since the original release, we’ve added new features and enhancements to help our users go even further.
In the latest episode of the Network AF podcast, your host Avi Freedman welcomes his friend and networking pro Cat Gurinski to the show. As a senior network engineer with loads of experience, Cat is most passionate about automation and troubleshooting, and especially loves to use Python and Arista’s pyeapi frameworks in her pursuits. She’s also the current chair of the NANOG Program Committee, and previously worked for companies like Best Buy, Switch and Data, and Equinix.
I have a good sense of how to use traces to understand my system’s behavior within request/response cycles. What about multi-request processes? What about async tasks spawned within a request? Is there a higher-level or more holistic approach?
This blog post defines SRE by explaining SLOs and error budgets, highlighting the innovation vs. reliability tradeoff.
With Kubernetes emerging as a strong choice for container orchestration for many organizations, monitoring in Kubernetes environments is essential to application performance. Kubernetes allows developers to develop applications using distributed microservices introducing new challenges not present with traditional monolithic environments. Understanding your microservices environment requires understanding how requests traverse between different layers of the stack and across multiple services.
If you are trying to compare all of the best solutions for application performance monitoring and management you may have found that it can be highly complicated to compare all of the available observability tools whilst also trying to keep within a reasonable budget.
Telegraf comes included with over 200+ input plugins that collect metrics and events from a comprehensive list of sources. While these plugins cover a large number of use cases, Telegraf provides another mechanism to give users the power to meet nearly any use case: the Exec and Execd input plugins. These plugins allow users to collect metrics and events from custom commands and sources determined by the user.
A common DevOps use case involves alerting when hosts stop reporting metrics, aka a deadman alert. This can be done using the monitor.deadman() Flux function. One can easily create a deadman (or threshold) check in the InfluxDB UI Alerts section or craft a custom task to alert as well. Check out InfluxDB’s Checks and Notifications system post for more details. It’s also possible to use the monitor.deadman() function directly in a dashboard cell.