Operations | Monitoring | ITSM | DevOps | Cloud

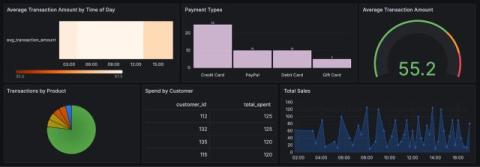
Data aggregation: Benefits and how it works

Data aggregation includes systematically collecting, transforming, and summarizing raw data from multiple sources. A unified, consistent view helps IT teams analyze vast amounts of information, uncover patterns, and derive actionable insights for informed decision-making. In our case, it’s all about enhancing incident management.

Common Kafka Errors and How to Resolve Them

If you’ve ever worked with Apache Kafka, you know that it’s a powerful tool, but it can also be a bit finicky. Things can go wrong, and when they do, it’s important to know how to troubleshoot and resolve those issues quickly. Over the years, I’ve encountered my fair share of Kafka errors—some that had me scratching my head for days and others that were relatively straightforward once I knew what to look for.

PID Controllers and InfluxDB: Part 2 - Digital Twin

In a previous post, we described a CSTR and a PID controller. This post will cover the code and architecture of the digital twin from this project repo. The project leverages Kafka for data streaming, Faust for data processing, InfluxDB for storing the time series data, and Telegraf for writing data from the topic to InfluxDB. We’ll also cover the advantages and disadvantages of this stack.

Three Advanced Notification Features that Your Site Uptime Monitoring Vendor MUST Deliver

To say that site uptime vendors deliver notifications is about as insightful as saying that cars have steering wheels, planes have wings, or TikTok videos have cringe. It’s a given. But this doesn’t mean that all vendors use the same notification playbook. Some vendors offer basic (read: superficial) notification features, while others offer advanced notification features.

How Memory Usage Patterns Can Derail Real-time Performance

In this article, we will learn how memory usage patterns can affect the real-time performance of an embedded application, drawing from a recent experience tracing an audio DSP application running on an embedded Linux platform. First, I will introduce the product in question and the real-time audio software I developed for it. Then, I’ll describe the issues I encountered with audio callbacks and the strategy I followed to determine the cause of the issues, ending with my solution and lessons learned.

Visualize CockroachDB in Grafana: Introducing the CockroachDB Enterprise data source

We’re excited to announce the addition of CockroachDB as an Enterprise data source for Grafana. The data source, available now in private preview, enables secure and seamless access to the CockroachDB distributed SQL database, while leveraging Grafana’s powerful visualization capabilities.

Icinga Director: Cloning dictionary row entries for objects from import sources

Over use of dictionaries in monitoring leads to complex and ugly configurations. This in turn makes monitoring complicated. Hence, it is advisable to use it, only if it is needed or in special cases. Even in these cases it is worthwhile to keep it simple. On that note, in this blogpost let me demonstrate how to clone dictionary row entries for objects from import sources to object properties in Icinga Director.

Splunk vs Prometheus: a Side-by-Side Comparison [2024 Guide]

When it comes to monitoring and observability, Splunk and Prometheus are two prominent tools with distinct strengths. Splunk excels in enterprise-level security and observability, while Prometheus is known for its efficient handling of time-series data. In this blog, I have compared these two tools, focusing on their unique features, and strengths. Remember, some insights may reflect personal preferences, helping you find the best fit for your specific monitoring needs.