Grafana v6.7 released: Dashboards, Gdocs, Azure OAuth and more
The Grafana v6.7 stable release includes improvements to Authorization and Enterprise reporting as well as a new plugin for Google Sheets. Check out the details below.

The Grafana v6.7 stable release includes improvements to Authorization and Enterprise reporting as well as a new plugin for Google Sheets. Check out the details below.
With every tech company on Earth suddenly pretending they’re remote-friendly overnight, there are a lot of posts about how to work well from home. As a matter of fact, we wrote our own, so why would we write another? The answer is: kids.
Most software architects and developers know that they need to monitor their systems. What often prevents them from implementing an effective monitoring solution is the plethora of choices they face. To set up a monitoring solution, you first have to decide what you want to monitor and how you want to monitor it. Then you have to settle for a collection and storage method. Next, you have to implement the interesting metrics in your system and start collecting them.
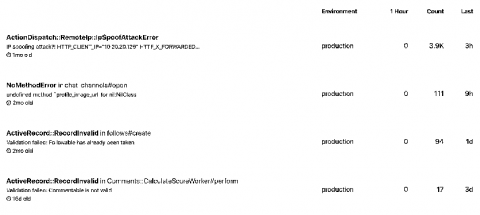
Are you on DEV? Did you know that it's open-source, and that it uses Honeybadger? We just launched a new feature to help communities like DEV fix more errors together! Software development is more fun with friends; that's why we've built tons of collaboration features into Honeybadger over the years, making it easier for teams to fix errors. Recently the team at DEV emailed us with a feature request: could we make it easier to involve the broader DEV open source community in the error-fixing process?
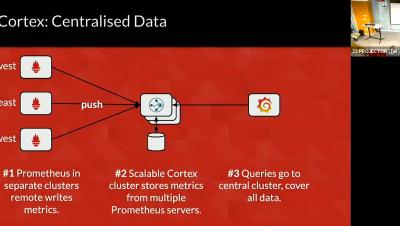
At FOSDEM 2020, Grafana Labs software engineers Tom Braack and Malcolm Holmes explained how and why the team developed Tanka, a scalable Jsonnet-based tool for deploying and managing Kubernetes infrastructure. They also shared how Grafana Labs leverages the project to manage and monitor its own infrastructure as well as showcased how Tanka makes deploying a Grafana instance faster and more efficient.
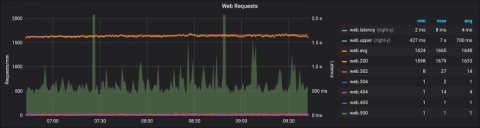
You’re done setting up your first graph panels. You want to do more, look around the visualization settings, and discover the settings for the X and Y axes. You stumble over the configuration for a “Right Y” axis. You ask yourself, “Why on earth would I need another Y axis?” You toggle it back and forth and change some settings, yet that makes no difference to your graph. What gives? Never fear.
So far, we’ve learnt how to collect data (part 2) and pull it into Azure Log Analytics (part 3), as well as how to actually work with the data using Kusto (part 4). Now it’s time to explore how we can visualize this data, make dashboards, share them with other teams in our organizations and so on. Unfortunately, dashboarding in Azure is not very sophisticated, and neither is it centralized.
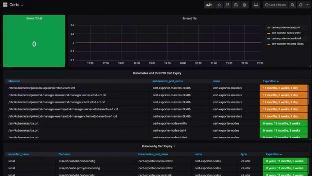
Certificates can be difficult to track and opaque to administrators, and if any expire without someone noticing, embarrassing outages can happen. At Grafana Labs we strive to make all things visible and observable; why should certificates be any exception? In this post we will explore an easy way to expose and monitor certificate expirations using Grafana and Prometheus.