The latest News and Information on Containers, Kubernetes, Docker and related technologies.
The recent public release of Cycle’s API has already seen all sorts of innovative uses, from automating the deployments of medical applications, to creating customized monitoring services to track specific performance metrics. Everything you can do in the portal can also be accomplished via the API — it’s actually the exact same API we used to build the portal!
AquaSec’s Daniel Sagi recently authored a blog post about DNS spoofing in Kubernetes. TLDR is that if you use default networking in Kubernetes you might be vulnerable to ARP spoofing which can allow pods to spoof (impersonate) the IP addresses of other pods. Since so much traffic is dialed via domain names rather than IPs, spoofing DNS can allow you to redirect lots of traffic inside the cluster for nefarious purposes.
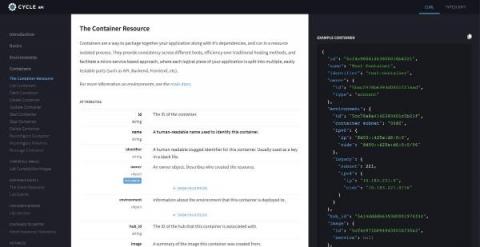
Cycle’s API docs are live, and with it a whole new suite of tools to automate the management of containers across cloud providers. This is the same API that Cycle’s portal is built upon, meaning you have near full capability to do anything programmatically that you can do through the interface.
In this blog, I will discuss about how to set up Prometheus and Grafana in EKS and how to monitor Python based applications using Prometheus.
We live in a containerized world, and traditional monitoring and logging are being forever changed. The dynamic and ephemeral nature of containers creates new logging challenges. Docker addresses these in some ways. Docker Engine provides various logging drivers that determine where logs are sent or written to. The default driver for Docker logs is “json-file,” which writes the logs to local files on the Docker host in json format.
Kubernetes has fundamentally changed the way we manage our production environments. The ability to quickly bring up infrastructure on demand is a beautiful thing, but along with it brings some complexity, especially when it comes to logging. Logging is always an important part of maintaining a solid running infrastructure, but even more so with Kubernetes. Because Kubernetes clusters are constantly being spun up, spun down, always in flux, making sure logging functions correctly is critical.
In the past I’ve written about how to use informers in Kubernetes for particular resources, but what if you need to be able to receive events for any Kubernetes resource dynamically? Well, there’s a client-go package for that too. At FireHydrant, we recently updated our Kubernetes integration to watch changes for any resource you configure and I wanted to write down how we made it at a high level.