Dashboards

Dashboards are dead; long live Reviews!

Dashboards are everywhere. We use them to inform us about the next big decision we need to make, understand the current state of our business, or see how our Engineering org is running. However, are dashboards actually useful? Are dashboards truly solving a problem for us? Ultimately, we don’t really want more data in our lives - we want answers. Getting these answers is not about adding another dashboard. It is about observing data and taking action to find answers that help us drive outcomes.

Beginners guide - Visualizing Canvas in Grafana | Grafana Labs

In this video, Grafana Developer Advocate Leandro Melendez describes how Canvas panels combine the power of Grafana with the flexibility of custom elements. They are extensible visualizations that allow you to add and arrange elements wherever you want within unstructured static and dynamic layouts. This lets you design custom visualizations and overlay data in ways that aren’t possible with standard Grafana visualizations, all within the Grafana UI.

SquaredUp Live 2024: A round-up of our virtual customer workshop

Last week, we were very excited to host our second virtual customer workshop! We’d received so much positive feedback on last year’s debut that we knew we had to do it again. Using the digital conferencing app Gather Town, we were pleased to welcome 89 attendees from 13 different countries to our virtual “SquaredUp Town”.

Create Drag-And-Drop Unit Cost Dashboards In Minutes

As 2024 peeks into 2025, cloud-driven businesses are poised for yet another year of record cloud spending. After exceeding $675B this year, cloud spenders are expected to shell out more than $820B in 2025 (Gartner). But as any good unit economist knows, it’s not just that cloud costs are growing, it’s that they’re growing inefficiently — taking too big a bite out of companies’ profits.

Grafana variables: what they are and how they create dynamic dashboards

A common pattern when building Grafana dashboards is to represent data for many items at once, such as simultaneously monitoring hundreds of servers. But what if there’s a problem with one of those servers? You’d want the ability to quickly identify that single server, and drill into the details without noise from all the other systems. In Grafana, dashboard variables are a great way to filter data and focus on the information that’s most important to you.

DORA Metrics in perspective

A friend of mine once had an annual appraisal where his manager blithely declared to him that his target for the next year was "to exceed his targets". Rather than spend the next year screaming silently whilst trapped inside an MC Esher-esque cycle of infinite recursion, my friend politely demurred and requested a more achievable goal, such as building a time machine out of jellybeans.

Edit your Git-based Grafana dashboards locally

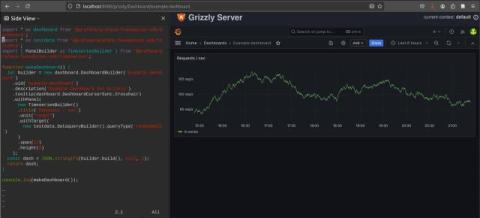
Grafana has grown to become one of the most prominent dashboarding tools available, with an extensive set of features that support organizations of all sizes. There can come a time, however, when you have too many dashboards. As a software engineer, you might think, “Why can’t I do with dashboards what I do with my code?” That is, you know how to keep your code in version control (e.g., Git). You know how to share and review your code with colleagues (e.g., pull requests).

Visualize GitHub repos, projects, and more: get started with the GitHub data source for Grafana

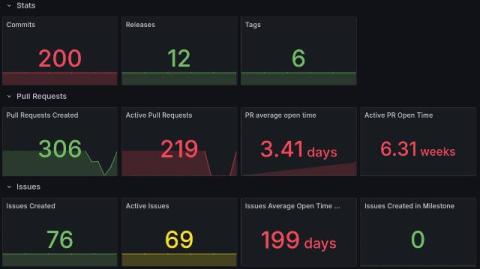
In 2020, we introduced the GitHub data source plugin for Grafana, helping organizations visualize and gain deeper insights into their use of the popular version control and collaboration platform. Since then, thousands of users have installed the data source, and we’ve been working hard to extend its capabilities and make it even easier to use.