Dashboards

No Code Observability with Grafana Beyla and eBPF | Explainer | Grafana

Discover how Grafana Beyla, powered by eBPF, brings no-code observability to your applications, revolutionizing how you manage applications. No more adding agents, redeployment, or tedious code changes! In this video, we break down how Grafana Beyla leverages eBPF (Extended Berkeley Packet Filter) to provide instant, reliable telemetry without touching your app’s code.

Grafana Cloud updates: redesigned dashboard filters, more ways to use RBAC, and more

We consistently roll out helpful updates and fun features in Grafana Cloud, our fully managed observability platform powered by the open source Grafana LGTM Stack (Loki for logs, Grafana for visualization, Tempo for traces, and Mimir for metrics). In case you missed them, here’s our monthly roundup of the latest and greatest Grafana Cloud updates. You can also read about all the features we add to Grafana Cloud in our What’s New in Grafana Cloud documentation.

Getting eyes on your KPIs!

The SquaredUp motto is Measure What Matters – sometimes though, the processes that really matter can be located at numerous different points up, down and across your organisational landscape. This can make surfacing your most important measures – i.e. your KPIs – somewhat problematic. At SquaredUp, we have been thinking hard about this problem and have now released the initial version of our solution – KPI roll-ups.

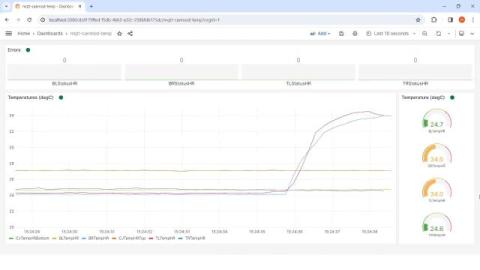
Visualize real-time CAN-to-USB data via custom Grafana dashboards and the MQTT plugin

Martin Falch, co-owner and head of sales and marketing at CSS Electronics, is an expert on CAN bus data. Martin works closely with end users, typically OEM engineers, across diverse industries (automotive, heavy-duty, maritime, industrial). He is passionate about data visualization and has been spearheading the integration of the CANedge/CANmod with Grafana dashboards through various data sources.

Grafana release cycle: end-of-year update

It’s been another big year for Grafana. In April, we unveiled Grafana 11.0 at GrafanaCon 2024, which introduced a queryless experience with Explore Metrics and custom visualizations with Canvas panels. Since then, we’ve made improvements to data sources and visualizations in our minor releases, and just last month the 11.3 release marked the general availability of Scenes-powered dashboards.

Top 10 Kibana Alternatives [2024 Guide]

Choosing the right data visualization and analysis platform is essential for gaining valuable insights, and while Kibana is a popular choice in the industry, it may not meet the specific needs of every organization. Whether you are looking for more cost-effective solutions, advanced features, or better scalability, there are several strong alternatives worth considering. In this guide, we will dive into the top 10 Kibana alternatives for 2024, highlighting what each option offers.

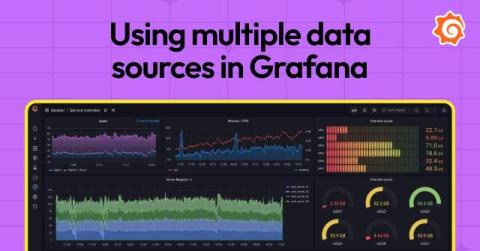
How to work with multiple data sources in Grafana dashboards: best practices to get started

Grafana dashboards enable you to visualize and correlate data from a wide range of sources. With a centralized view of your data, you can troubleshoot faster, make better decisions, and streamline monitoring. But for those of you ramping up with Grafana, you might have a few questions about how, exactly, to create these rich dashboards featuring data from disparate sources, or even how to incorporate multiple queries from a single source into your visualization.

Deploying the Loki Helm on AWS | Grafana

One of our most requested Loki tutorials is here! Deploying the Loki Helm on AWS . In this video, we’ll walk you through the entire process of deploying the Loki Helm on AWS; from creating a Kubernetes cluster to configuring essential AWS resources to learning best practices when creating your Helm values file. If you are struggling with your first production deployment this should get you up and running so you can store your logs.