Dashboards
The Business of Grafana
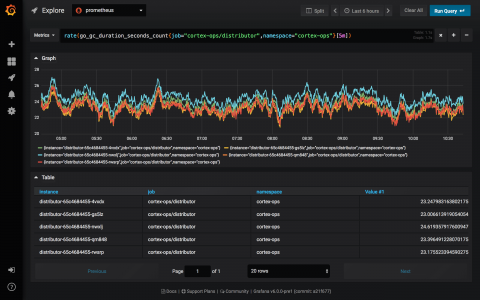
The Explore Workflow and Troubleshooting with Loki
Today's Challenges of Big Infra Monitoring
How Not to Fail at Data Visualization
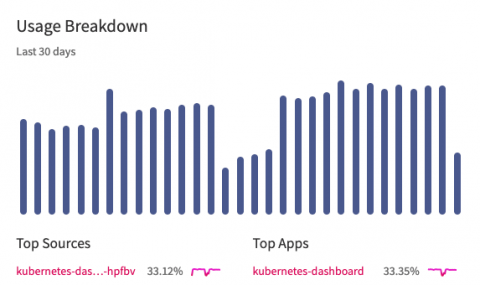
Announcing the Enhanced Usage Dashboard
Many of our users are responsible for monitoring logs to detect sudden changes in volume or to control the budget. To help you with this goal, we’re excited to announce new enhancements to our usage dashboard.
February Launch Notes: The latest Dashboard enhancement for RUM and more
Raygun’s Launch Notes are your regular round-up of all the improvements we made to Raygun last month—from major features to performance updates.
New dashboards for popular Azure services
With the growing number of customers monitoring Azure in Datadog, we saw a great opportunity to help our users get faster visibility across their dynamic cloud environments. We’re happy to announce the release of new out-of-the-box dashboards for several Azure services.
Grafana v6.0 Released
v6.0 Stable released! GrafanaCon LA is underway! Check out the live stream on the Grafana youtube channel. I am proud to announce that we are releasing Grafana v6.0 stable today. Before every major release I feel super excited about the progress that has been made and with this release, this is especially true.
What is Grafana? Let's see its history and how it is related to other software!
Grafana is an open source tool, with Apache 2.0 license, designed by Torkel Ödegaard (who is still in charge of its development and maintenance) and created in January 2014. This Swedish developer began his career in the .NET field and since 2012, until nowadays, he continues offering development and consulting services through this popular proprietary platform, while developing free software at the same time.


