Dashboards

How PostgreSQL and Grafana Can Improve Monitoring Together

TimescaleDB is an open source database packaged as a Postgres extension that supports time series, but “it looks as if it were just Postgres,” said Timescale’s Head of Product, Diana Hsieh. “So you can actually use the entire ecosystem. You can use all of the functions that are enabled in Postgres – like JSON indexes, relational tables, post JSON – and they all work with Timescale.”

Grafana Labs at KubeCon: Awesome Query Performance with Cortex

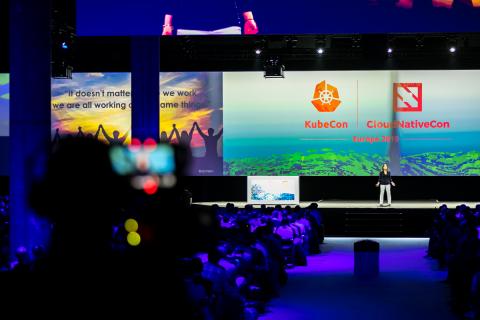
At KubeCon + CloudNativeCon in Barcelona last week, Weaveworks’ Bryan Boreham and I did a deep-dive session on Cortex, an OSS Apache-licensed CNCF Sandbox project. A horizontally scalable, highly available, long term storage for Prometheus, Cortex powers Grafana Cloud’s hosted Prometheus. During our talk, we focused on the steps that we’ve taken to make Cortex’s query performance awesome.

Grafana Labs at KubeCon: Foolproof Kubernetes Dashboards for Sleep-Deprived On Calls

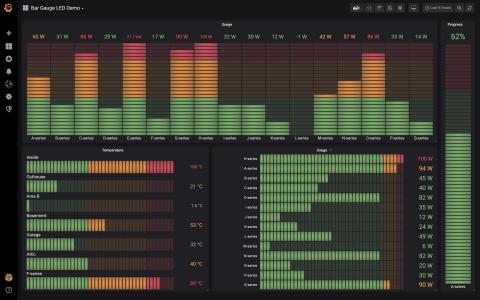
We’ve all been in the situation where suddenly you are the lone developer on call while everyone is out of pocket. Or in the case of Grafana Labs Director of UX David Kaltschmidt, his then business partner, Grafana Labs VP of Product Tom Wilkie, was checking out for a weekend music fest. “Tom and I founded a company a couple of years ago, and I’m more of a frontend person. Tom did all the backend and devops stuff,” explained Kaltschimdt.

Grafana Labs at KubeCon: The Latest on Cortex

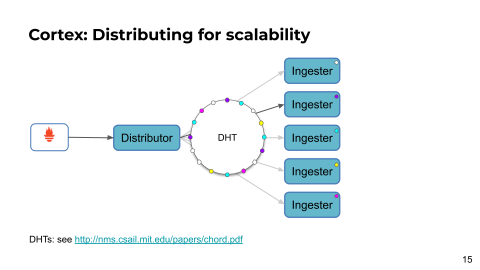
Grafana Labs has been running Cortex for more than a year to power Hosted Prometheus in Grafana Cloud. We’re super happy: It’s been incredibly stable and has recently gotten insanely fast. Here’s what you need to know about Cortex, what we’ve been doing to Cortex in the past year, and what we plan on doing in the coming months.

How Verizon Achieved Automation and Self-Service with Grafana

Can you monitor us now? That was the question Verizon started asking as the Fortune 500 company expanded its portfolio beyond communications services to include brands such as Yahoo! and Huffpost. “We’re not just grandma’s landline,” Sean Thomas, Verizon Systems Engineering Manager, told the audience at GrafanaCon in L.A. “We’re not just your mobile provider. We are a media company. We have 5G solutions. We’re building technology.

Worth a Look: Public Grafana Dashboards

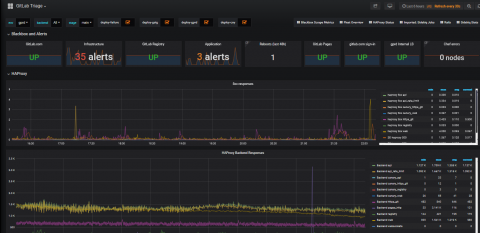
There are countless Grafana dashboards that will only ever be seen internally. But there are also a number of large organizations that have made their dashboards public for a variety of uses. These dashboards can be interesting to browse, giving you an insider’s peek into how real Grafana users set up their visualizations, with actual live data to boot. Perhaps some of them will inspire you to get to work on your own Grafana?

How to Streamline Infrastructure Monitoring with Sensu, InfluxDB, and Grafana

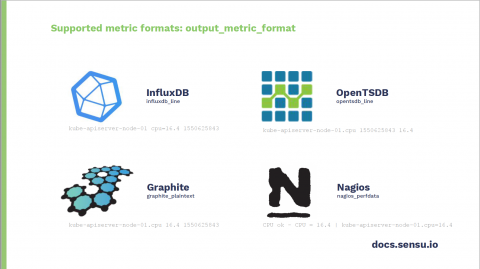
“To start, your monitoring stack should not cost you stacks,” Sensu Software Engineer Nikki Attea told the crowd at GrafanaCon L.A. “Avocado toast is really expensive. But the good news is your monitoring solution doesn’t have to be.” To prove it, Attea presented an easy developer-centric use case that leverages Sensu, a monitoring event pipeline which collects, processes, and roots different event types including discovery, availability, telemetry, and alerts.