Dashboards

Coming Soon: Seamless and Cost-Effective Meta Tags for Metrictank

One of the major projects we’re working on for Metrictank – our large scale Graphite solution – is the meta tags feature, which we started last year and are targeting to release in a few months. A lot of people don’t realize this, but Graphite has had tag support for more than a year. Our mission with Metrictank is to provide a more scalable version of Graphite, so introducing meta tags was a logical next step.

How eBay Moved from Custom UIs to Grafana Plugins

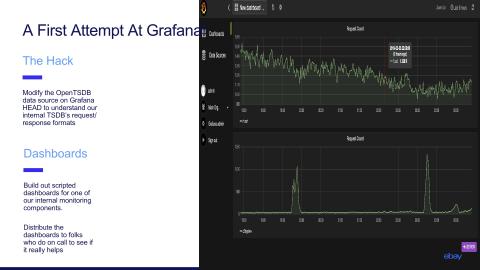
In the beginning, the mission of the logging and monitoring team at eBay was simple: “to give out APIs that the developers in the company could use to instrument their applications [in order] to send logs,” Vijay Samuel said during his talk at GrafanaCon about eBay’s journey to using Grafana plugins. “We had our own developers who built out UIs for being able to search view and debug their issues. And metrics were no different from logs.

A Look at the Latest Cloud Data Source Plugins in Grafana

The engineers at Grafana Labs have their heads in the clouds. “This is a new world: We have hybrid clouds and multiclouds,” Daniel Lee told the crowd gathered at GrafanaCon 2019 in Los Angeles. And the advantage clients have when using Grafana’s hosted services is that “they can deploy them on any cloud,” said Lee.

Grafana Plugin Tutorial: Polystat Panel (Part 1)

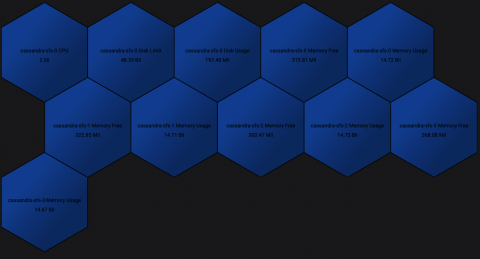
The grafana-polystat-panel plugin was created to provide a way to roll up multiple metrics and implement flexible drilldowns to other dashboards. This example will focus on creating a panel for Cassandra using real data from Prometheus collected from our Kubernetes clusters. We’ll focus on the basic metrics for CPU/Memory/Disk coming from cAdvisor, but a well-instrumented service will have many metrics that indicate overall health, such as requests per second, error rates, and more.

Tinder & Grafana: A Love Story in Metrics and Monitoring

Tinder is the world’s most popular dating app, with more than 26 million matches made each day. But two years ago, when it was time for the L.A.-based company to find and implement a perfect metrics monitoring partner, the process proved to be more slow-burn love affair versus whirlwind romance.

Icinga Camp Berlin 2019 | Dashboards for Your Management with Kibana Canvas by Philipp Krenn

This talk gives a quick overview of Kibana Canvas. First we are exporting some Icinga data to Elasticsearch and then we will turn to the special capabilities of Canvas — a new component of Kibana. It is both powerful and also a bit scary initially, since all you have is a white canvas on which you can arrange visualizations, logos, texts,… any way you want. We put together some screens, which are live updating and still ready for management.