Operations | Monitoring | ITSM | DevOps | Cloud
The latest News and Information on Containers, Kubernetes, Docker and related technologies.
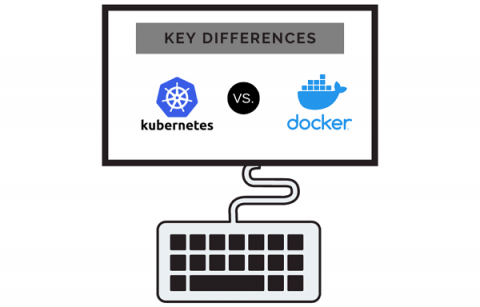
Kubernetes vs Docker: Key Differences
It's impossible to learn about containerization without hearing about Docker and Kubernetes. These two tools together dominate the world of containers, both being the de-facto standard in what they each do. When you're first getting started learning about containers, it can be quite a challenge to figure out what the differences are between these two tools.
Is your database on Kubernetes production-ready?
Last May, KubeCon gathered multiple tech enthusiasts, students, professionals, and companies. The event highlighted various topics and insights on how to collaborate on pushing the boundaries of cloud-native computin One of our Engineering Directors, Mykola Marzhan, shared his knowledge about databases on Kubernetes at KubeCon, during a session organised by the DoK.Community. We’ve picked out some of the key highlights from the talk below.
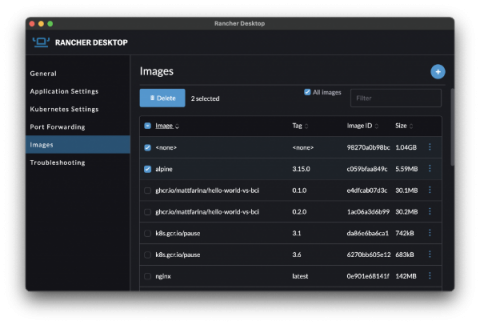
Rancher Desktop 1.4: Now With Credential Helpers and More
In addition to the usual updates to supporting utilities, Rancher Desktop 1.4 adds a couple of new useful features we think you’ll like.
Key advantages of the Calico eBPF data plane
Project Calico has offered a production-ready data plane based on eBPF since September 2020, and it’s been available for technical evaluation for even longer (since February 2020). The pre-requisites and limitations are simple to review, it’s easy to enable, and it’s easy to validate your configuration. So, there’s never been a better time to start experiencing the benefits! You do know what those are, don’t you? Don’t worry if not!
K8s monitoring and observability with ContainIQ
KubeCon + CloudNativeCon EU 2022 Wrap up - Civo
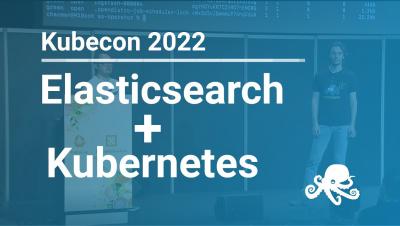
Use Kubernetes to Manage Eleasticsearch Clusters for Logging | Sematext at Kubecon 2022
Your First Shipa Canary Deployment(s)
Lineage to the saying “canary in a coal mine”, the canary deployment/release methodology is an incremental release focused on safety. If the canary does not pass, the deployment does not continue or is rolled back. Taking a jog down memory lane, like Kubernetes the Hard Way, a few years ago a canary deployment in Kubernetes was quite the undertaking.
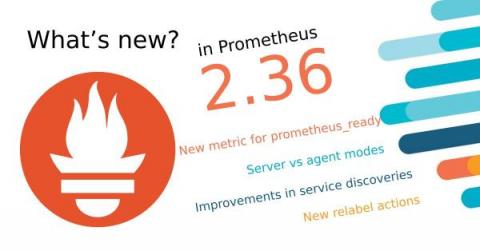
Prometheus 2.36 - What's new?
In this article, we will analyze some new features and the impact they might have on the Prometheus community. Here’s our editor’s pick.


