Operations | Monitoring | ITSM | DevOps | Cloud

APM

The latest News and Information on Application Performance Monitoring and related technologies.

Your Guide To Datadog Cost Optimization: 7 Tips For Reducing Spend

As cloud systems become increasingly sophisticated, you want a cloud monitoring platform that helps you identify, isolate, and fix root-cause issues. Meanwhile, engineering leaders are under increasing pressure to reduce technology costs as the global economic outlook remains uncertain. With Datadog, you can observe, monitor, analyze, and report on the health of your infrastructure, applications, and services in any cloud and at scale.

Optimizing E-commerce Application Performance (APM) During High-Traffic Holidays!

Everyone within an e-commerce business knows that the stakes are high during peak shopping events such as Black Friday, Christmas, and many other holiday seasons. Periods like these are make-or-break for your revenue. Application performance is the key to success. A slow e-commerce website, stalled transactions, or unanticipated downtime invariably leads to frustrated customers, lost sales, and long-term damage to a brand’s reputation.

Monitoring your Express application using OpenTelemetry

Nodejs is a popular Javascript runtime environment that executes Javascript code outside of a web browser. Express is the most popular web frameworks that sits on top of Nodejs and adds functionalities like middleware, routing, etc. to Nodejs. You can monitor your express application using OpenTelemetry and a tracing backend of your choice.

Monitoring your Nextjs application using OpenTelemetry

Nextjs is a production-ready React framework for building single-page web applications. It enables you to build fast and user-friendly static websites, as well as web applications using Reactjs. Using OpenTelemetry Nextjs libraries, you can set up end-to-end tracing for your Nextjs applications. Nextjs has its own monitoring feature, but it is only limited to measuring the metrics like core web vitals and real-time analytics of the application.

Implementing OpenTelemetry in a Rust application for performance monitoring

OpenTelemetry can be used to trace Rust applications for performance issues and bugs. OpenTelemetry is an open-source project under the Cloud Native Computing Foundation (CNCF) that aims to standardize the generation and collection of telemetry data. Telemetry data includes logs, metrics, and traces. Rust is a multi-paradigm, general-purpose programming language designed for performance and safety, especially safe concurrency.

re:Invent Recap Livestream: 2024

Did you miss this year’s re:Invent? Or maybe you were onsite but too busy deep diving on certifications, new products, and networking. Don’t worry—the Datadog team is streaming right to your home on December 17 to recap all of the highlights from the event. Join Andrew Krug from Datadog’s Technical Community along with a host of AWS guests to hear about exciting announcements from AWS re:Invent 2024, Datadog’s latest product launches, and a rundown of the best on-demand sessions that you’ll want to make sure to tune into.

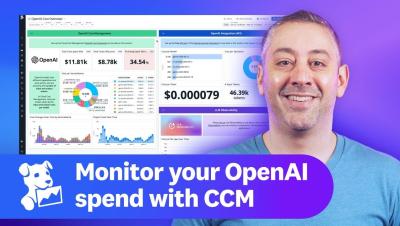
This Month in Datadog: Monitor OpenAI costs, Kubernetes Active Remediation, IaC Security, and more

Datadog is constantly elevating the approach to cloud monitoring and security. This Month in Datadog updates you on our newest product features, announcements, resources, and events. To learn more about Datadog and start a free 14-day trial, visit Cloud Monitoring as a Service | Datadog. This month, we put the Spotlight on Datadog Cloud Cost Management for OpenAI.

New Microsoft ILogger integration with Raygun

That’s a wrap on Raygun’s 12 Days of Christmas 2024! Over the past two weeks, we’ve rolled out daily updates featuring bug fixes and feature improvements inspired by your feedback. These small but mighty changes are all about making Raygun faster, smoother, and easier to use. Thanks for helping us level up—your input makes all the difference. Our special thanks to Blair from New Zealand who suggested this great idea!

New option to reverse stack traces in Crash Reporting

This enhancement is part of Raygun’s 12 Days of Christmas 2024. Over the past few weeks, we’ve shared daily updates on bug fixes and feature improvements inspired by feedback from you, our customers. These are the small but impactful changes you’ve asked for, designed to make Raygun faster and easier to use. Merry Christmas and thanks for following along—we’re excited to keep enhancing the tools you rely on!