Operations | Monitoring | ITSM | DevOps | Cloud

APM

The latest News and Information on Application Performance Monitoring and related technologies.

Spring Boot Monitoring with Open-Source Tools

Spring Boot Monitoring aims to provide real-time insights into various aspects of a Spring Boot application. Spring Boot provides useful libraries like the Spring Boot Actuator and Micrometer to aid in monitoring. But in order to set up effective monitoring, you need to use a tool where you can send the monitoring data for storage and visualization. In this tutorial, we cover: In this tutorial, you will learn how to monitor a Spring Boot application with SigNoz and OpenTelemetry.

7 Million Docker Downloads, uPlot Charting Library, and Improvements in Dashboard - SigNal 31

Welcome to the 31st edition of our monthly product newsletter - SigNal 31! We shipped a lot of improvements in our dashboard user experience and crossed 7 million Docker downloads. Let’s see what the humans of SigNoz did in the month of November 2023.

Nginx Metrics and Logs Monitoring with OpenTelemetry

Nginx metrics and logs monitoring are important to ensure that Nginx is performing as expected and to identify and resolve problems quickly. In this tutorial, you will install OpenTelemetry Collector to collect Nginx metrics and logs and then send the collected data to SigNoz for monitoring and visualization. In this tutorial, we cover: If you want to jump straight into implementation, start with this pre-requisites section.

ML and APM: The Role of Machine Learning in Full Lifecycle Application Performance Monitoring

The advent of Machine Learning (ML) has unlocked new possibilities in various domains, including full lifecycle Application Performance Monitoring (APM). Maintaining peak performance and seamless user experiences poses significant challenges with the diversity of modern applications. So where and how does ML and APM fit together? Traditional monitoring methods are often reactive, resolving concerns after the process already affected the application’s performance.

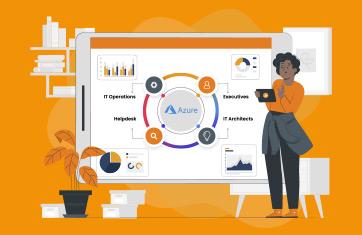
AVD Monitoring for MSPs (Managed Service Providers)

AVD (Azure Virtual Desktop) has grown in popularity and for many reasons many organizations are choosing to consume AVD via a specialist Managed Service Provider (MSP). For the MSPs offering AVD, monitoring and troubleshooting AVD especially for multi-tenant environments is challenging and involves significant, costly and skilled effort using native tools such as Azure Insights or Azure Monitor.

How to Monitor MongoDB Metrics with OpenTelemetry

For high throughput systems that focus on gathering continuous data or have a heavy read-only traffic, NoSQL databases came as a blessing. NoSQL databases, due to their unstructured nature of data, allow relatively faster inserts as well as reads compared to relational databases. One such database that’s quite popular today is MongoDB. In this article, our focus would be to understand how to extract metrics out of MongoDB and ship them to Signoz using the Open Telemetry collector.

Memcached Metrics Monitoring with OpenTelemetry

Let's dive deep into the realm of Memcached, where we'll uncover the power of monitoring with OpenTelemetry and SigNoz. This isn't just about caching data; it's about watching over Memcached like a vigilant guardian, ensuring it performs at its best, and optimizing your application's speed. In this tutorial, you will install OpenTelemetry Collector to collect Memcached metrics that should be monitored for performance and then send the collected data to SigNoz for visualization and alerts.

Streamline your CD pipeline for Cisco Cloud Observability

How can you leverage a monitoring-as-code mechanism to initiate new workload monitoring, or to create new visualizations? In this demo, see how Cisco AppDynamics can integrate with Flux CD (Continuous Delivery)—a GitOps Kubernetes operator tool that offers a simple and efficient interface to synchronize manifests within CD workflows from GitHub repositories. See how easy it is to upgrade existing software with just a few lines of code such as when instrumenting new workloads with the OpenTelemetry Agent or customizing a Grafana dashboard.