Operations | Monitoring | ITSM | DevOps | Cloud

APM

The latest News and Information on Application Performance Monitoring and related technologies.

OpenTelemetry vs Datadog - Choosing the Right Monitoring Tool

OpenTelemetry and DataDog are both used for monitoring applications. While OpenTelemetry is an open source observability framework, DataDog is a cloud-monitoring SaaS service. OpenTelemetry is a collection of tools, APIs, and SDKs that help generate and collect telemetry data (logs, metrics, and traces). OpenTelemetry does not provide a storage and visualization layer, while DataDog does.

Datadog vs Dynatrace [Comprehensive Comparison for 2024]

In complex IT environments, monitoring and observability tools are indispensable. They help organizations ensure optimal performance of applications and infrastructure, providing insights and alerts to address potential issues before they impact users. Two of the leading tools in this space are Datadog and Dynatrace. This article offers a comprehensive comparison of these platforms to help you decide which is best for your needs in 2024.

Introducing Log Observer Connect in Action

With Log Observer Connect for Cisco AppDynamics, your team will quickly identify and find the root cause of issues. Combining the most advanced full-stack APM solution with precision log analysis by Splunk, trouble tickets are remediated with less time and effort. See it in action with this demonstration by Leandro Oliveira, Cisco AppDynamics Systems Engineer.

Prometheus vs InfluxDB - Key Differences, concepts, and similarities

Prometheus and InfluxDB are open-source projects created to make application performance monitoring a breeze. That is, of course, if you choose the option that covers your entire observability scope. This article compares and contrasts the extent to which Prometheus and InfluxDB remedy the need for real-time insights into your applications’ operations. We’ll highlight similarities and overlaps in both usability and practicality.

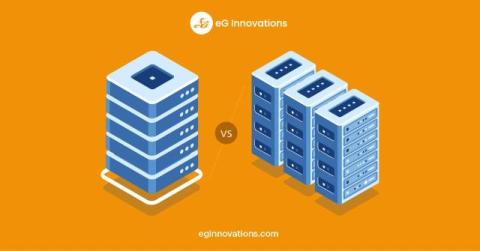
Understanding Scale Up vs. Scale Out - And Why You Need to Understand Scale Up vs. Scale Out to Be a Nutanix or HCI Guru

When your IT systems are nearing capacity, you need to make decisions to expand provision, and many of those decisions will revolve around the choices you make to scale up vs scale out. For many the decision is intrinsically linked to their choice of platform and whether they are looking at cloud based, hybrid infrastructure or on-premises led strategies.

Dynatrace vs AppDynamics - A Feature Comparison Guide

Dynatrace and AppDynamics are two of the most well-known Observability and monitoring tools. Even though they share many features, they have several differences that might make you choose one over the other. Dynatrace is great for comprehensive system performance monitoring. It covers everything from infrastructure and application performance to log management and real user monitoring. AppDynamics, on the other hand, focuses more on application performance and business transactions.
Sponsored Post

Effortless error monitoring for Adobe Commerce: Introducing the free Magenizr Raygun module

At Magenizr, we're always looking for tools to make life easier for developers and merchants. Not too long ago, we found ourselves in a bind. We were scouring the Adobe Commerce Marketplace and Github repositories for an error monitoring app tailored for e-commerce shops but came up empty-handed. New Relic was overkill for shops that just needed to pinpoint where errors were cropping up.

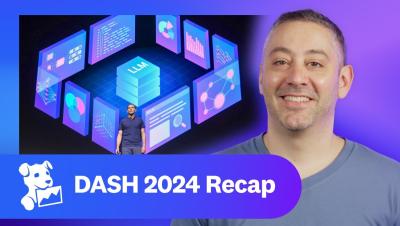
This Month in Datadog: DASH 2024 recap, featuring LLM Observability, Log Workspaces, and more

Datadog is constantly elevating the approach to cloud monitoring and security. This Month in Datadog updates you on our newest product features, announcements, resources, and events. To learn more about Datadog and start a free 14-day trial, visit Cloud Monitoring as a Service | Datadog. This month, we’re recapping our flagship conference, DASH.