Operations | Monitoring | ITSM | DevOps | Cloud
APM
The latest News and Information on Application Performance Monitoring and related technologies.
Monitoring SAP Services End-to-End
A typical SAP deployment is usually a sprawling, complex system and is one of the most critical applications an enterprise relies on to keep the business functioning, with it interacting with production, sales, dispatch, HR, and other areas of the business. Monitoring the performance and availability of SAP is therefore the key. Proactive monitoring may allow minor issues to be resolved before they become major issues.
A major release, tons of bug fixes and amazing new contributors - Signal #03
8 Dynatrace Alternatives to Consider in 2021
Everywhere you look, you see something to do with software and applications. But for all this software to work well, the people behind them have to know how they work. For a software developer, this comes as no surprise. They need to know how their code is working when deployed. Before the software deploys, they want to iron out errors, so they don’t become problematic and frustrate customers.
Extend Your APM Capabilities With End-User Data
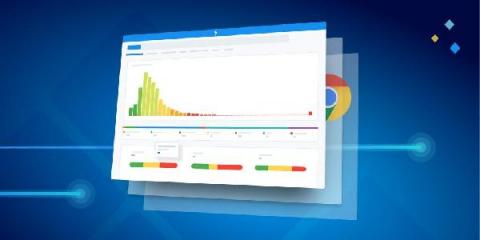
Announcing: Greater visibility into Core Web Vitals
Monitor your Tomcat Java Application in 20 mins with OpenTelemetry & SigNoz
What is Application Performance Management (APM)? Overview and 11 Features to Look for in APM Tool
Application Performance Management is all about gaining a complete picture of your applications' inner workings so you can make sure they're performing as they should. APM tools make it easier for developers to spot issues that are preventing their applications from providing outstanding user experiences. Furthermore, these monitoring services can help to limit the danger of fatal outages and downtime, which can be extremely costly for any company.


