Using Trend Analysis for Better Insights
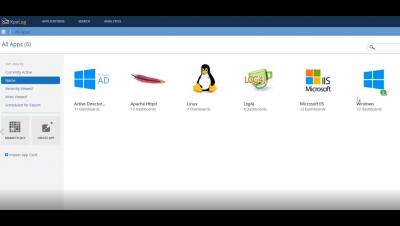
Centralized log collection has become a necessity for many organizations. Much of the data we need to run our operations and secure our environments comes from the logs generated by our devices and applications. Centralizing these logs creates a large repository of data that we can query to enable various types of analysis. The most common types are conditional analysis and trend analysis. They both have their place, but trend analysis is perhaps the more often underutilized source of information.