The latest News and Information on Distributed Tracing and related technologies.
Editor’s note: This post is a collaboration between Tim Tully, Splunk CTO, and Spiros Xanthos, Splunk’s vice president of product management for observability and IT Ops and previously the founder and CEO of Omnition. My love for the open-source software movement began with Linux in the ’90s and grew during my time at Yahoo! in the early days of Hadoop.
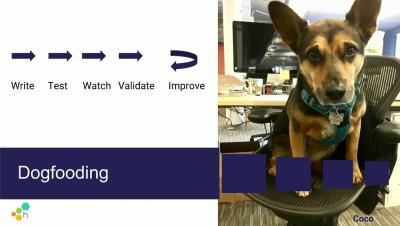
At Honeycomb, we talk a lot about eating our own dogfood. Since we use Honeycomb to observe Honeycomb, we have many opportunities to try out UX changes ourselves before rolling them out to all of our users. UX doesn’t stop at the UI though! Developer experience matters too, especially when getting started with observability. We often get questions about the difference between using our Beeline SDKs compared with other integrations, especially OpenTelemetry (abbreviated “OTel”).
August 3rd, 2015 was the date of the first commit in the internal Jaeger repository at Uber. Technically, the true birthday of the project was probably a week or so earlier, because while I was prototyping the collector service we went through a number of project names, some of them rather embarrassing to name here, and the real first commits happened in a differently named repository.
Curious how to get data flowing from your Go application into Honeycomb using OpenTelemetry? This guide will help you step by step through adding OpenTelemetry into your web service and sending the data to Honeycomb.