Operations | Monitoring | ITSM | DevOps | Cloud

Tracing

The latest News and Information on Distributed Tracing and related technologies.

Enhance Your AIOps Strategy by Utilizing Data Classification

Are you looking for a way to increase your AIOps signal to noise ratio and get more value from your data? In this article we will explore how one can utilize OpenTelemetry’s collectors, processors and data models to add or enhance classification attributes. These attributes can help you use your AIOps tools more efficiently and derive more value from your current data.

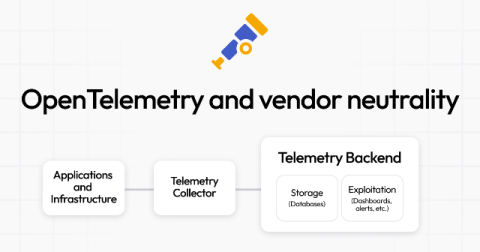
OpenTelemetry and vendor neutrality: how to build an observability strategy with maximum flexibility

One of the biggest advantages of the OpenTelemetry project is its vendor neutrality — something that many community members appreciate, especially if they’ve spent huge amounts of time migrating from one commercial vendor to another. Vendor neutrality also happens to be a core element of our big tent philosophy here at Grafana Labs. We realize, however, that this neutrality can have its limits when it comes to real-world use cases.

Managing a custom distribution OTel collector with BindPlane

Exciting news: it’s now possible to build a custom distribution of the OpenTelemetry Collector and remotely manage it with BindPlane. Though not all of BindPlane’s capabilities are available when managing a custom distribution (yet), it’s #prettycool, as it cracks open the door for teams looking to BYOF (bring your fleet), and manage them with our OTel-native telemetry pipeline.

Automatic Discovery and Instrumentation of PostgreSQL with Splunk OpenTelemetry Collector

In this video I’ll walk through the steps to instrument a PostgreSQL database using the Automatic discovery and configuration feature of the Splunk OpenTelemetry Collector. We’ll use an install script to install and run the Collector with discovery mode on a Linux machine where the database is running. I’ll then show you how to properly configure the PostgreSQL receiver properties so that the Collector is able to connect and authenticate to the database. Once the Collector is successfully configured, I’ll show you how to view those metrics in Splunk Observability Cloud.

Strategies For Reducing Observability Costs With OpenTelemetry

Keeping smooth and safe operations now relies entirely on observability. But as there's more and more data to keep track of, the costs are going up. This makes it hard for your companies to balance how well things are running and their budgets. OpenTelemetry can help by making a standard way to collect and process all the data. We're going to share how OpenTelemetry can save you money on observability and why having too much data can be costly.

The Importance of Securing Data in Traces

Trace spans are captured in the runtime after decrypting the request. This means that any sensitive data is available in plain text. This is also the case for logging; however, logging requires an explicit log statement to be coded by the engineer. Additionally, engineers can add arbitrary information to trace spans, which could expose sensitive information. Collecting sensitive information in trace spans or logging events could expose an organization to a number of risks.

Continuing Our OpenTelemetry Story With New Versions, Logs, Batching, and More Metrics

Last time we spoke, I told you about our (then) brand-spankin’-new OTel over HTTP implementation, in both our OpenTelemetry Source and Destination. That was a little over a year ago, also known as a lifetime in tech! I wanted to take another opportunity to speak to you and introduce some of our new OpenTelemetry features, and share how you can put them into practice!