Operations | Monitoring | ITSM | DevOps | Cloud

Grafana

Grafana Loki 2.2 released: Multi-line logs, crash resiliency, and performance improvements

I imagine everyone is long since tired and bored with their Loki 2.1 end of year/holiday gift, so I’m here today to bring some really exciting news. Loki 2.2 is released!!! New to Loki? Want a refresher? Owen Diehl and I did a webinar not long ago. Check out the on-demand video for a good overview of what Loki is capable of in 2021! Lots of new features are in this release, but worth celebrating in particular is that the single most requested feature for Loki has been added!

The basics of IoT, and why Prometheus works so well with it

Before we start, please take a moment to appreciate what day it is. IoT, or Internet of Things, has been a buzzword for longer than usual. Buzzwords usually have two common properties, and then their paths fork. I like thinking about buzzwords and about the useful aspects of what they mean. The most recent public example focuses on another buzzword currently in its hype phase: observability.

A closer look at the admin API and plugin for centralized tenant adminstration and control in Grafana Enterprise Logs

To follow up on our introduction of Grafana Enterprise Logs, the latest addition to the Grafana Enterprise Stack, let’s dig into one of the key features: the admin API and admin plugin. Grafana Loki, Grafana Labs’ log aggregation project, provides the underpinnings of Grafana Enterprise Logs (GEL).

How I built a monitoring system for my avocado plant with Arduino and Grafana Cloud

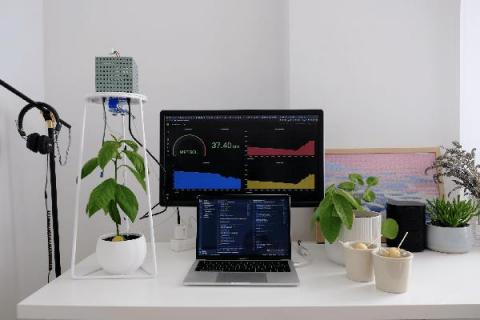
A couple months ago, during our Grafana hack days, I created my first monitoring solution: my sourdough monitoring system. It was a lot of fun to build it, and I enjoyed it a lot! So when the next Grafana hack day was approaching, I started to wonder what my next monitoring system could be. What would I like to learn more about? What would I like to get better at doing? To be honest, I didn’t have to think hard.

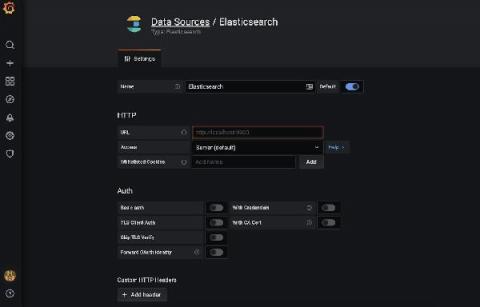
Why we're partnering with Elastic to build the Elasticsearch plugin for Grafana

As I’ve often talked about before, we have a “big tent” philosophy at Grafana Labs. We believe our users should determine their own observability strategy and choose their own tools; Grafana allows them to bring together and understand all their data, no matter where it lives. In practice, that means that we want to support data sources that our users are passionate about.

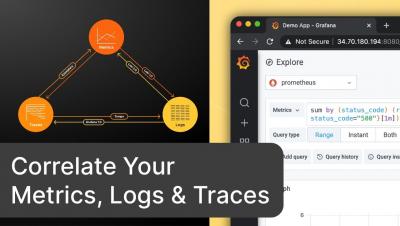
Correlate Your Metrics, Logs & Traces with the curated OSS observability stack from Grafana Labs

Correlation between metrics, logs, and traces should be as effortless as possible. This helps you make better decisions and actions. The Grafana Labs open-source observability stack enables powerful correlations between your metrics, log, and traces. The key here is to have consistent metadata across the three pillars of observability. Let me demo you how this works in this video.

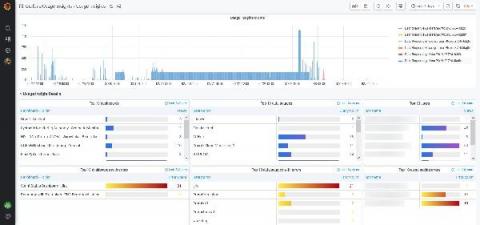
New in Grafana 7.4: Export usage data to Loki to help manage dashboard sprawl and troubleshoot faster

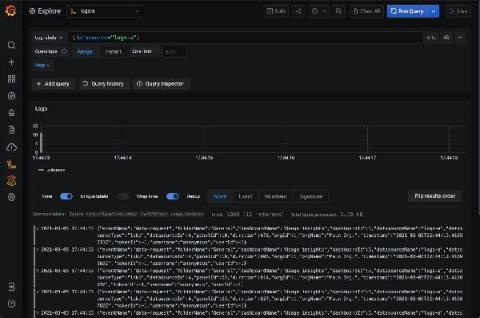
We first released the usage insights Enterprise feature in Grafana 7.0 based on feedback from customers that they would like to better understand how their users are interacting with Grafana, including the dashboards they visit, the information they query, and where they run into issues. What we learned was that dashboard sprawl is a real issue: Administrators estimate that almost 60% of dashboards might not be used at all.

Troubleshoot problems using GitLab activity data with the new plugin for Grafana

GitLab is one of the most popular web-based DevOps life-cycle tools in the world, used by millions as a Git-repository manager and for issue tracking, continuous integration, and deployment purposes. Today, we’re pleased to announce the first beta release of the GitLab data source plugin, which is intended to help users find interesting insights from their GitLab activity data.

You should know about... transformations in Grafana

Transformations were introduced in Grafana v7.0, and I’d like to remind you that you can use them to do some really nifty things with your data. All performed right in the browser! Transformations process the result set of a query before it’s passed on for visualization. They allow you to join separate time series together, do maths across queries, and more. My number one use case is usually doing maths across multiple data sources.