Operations | Monitoring | ITSM | DevOps | Cloud

Grafana

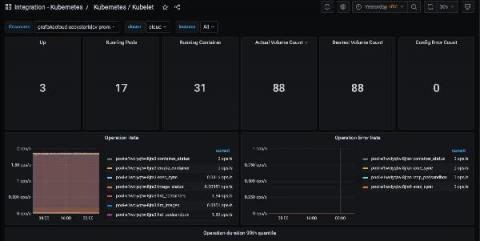
Easily monitor and alert on your Kubernetes clusters with the new Grafana Cloud integration

Today we’re excited to introduce the Kubernetes integration for Grafana Cloud, our composable observability platform bringing together metrics, logs, and traces with Grafana. Grafana Cloud users can now easily monitor and alert on core Kubernetes cluster metrics using the Grafana Agent, our lightweight observability data collector optimized for sending metric, log, and trace data to Grafana Cloud.

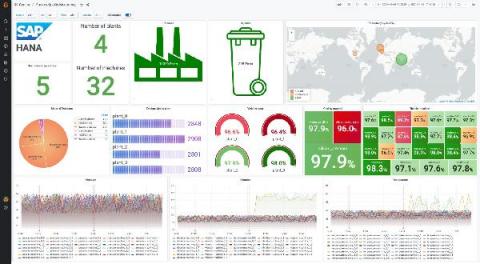
Monitor your production line with the new Grafana Enterprise data source plugin for SAP HANA

Greetings! This is Abdelkrim from the Solutions Engineering team, and I am with Sriram from the Enterprise Plugin team. We both joined Grafana Labs in February this year, and we already have some stories to share with you. I came to Grafana Labs from a big data and analytics background, and I witnessed a lot of companies storing monitoring and performance data in all kinds of analytics platforms (data lakes, data warehouses, cloud, etc.).

How to correlate Graphite metrics and Loki logs

Grafana Explore makes correlating metrics and logs easy. Prometheus queries are automatically transformed into Loki queries . And we will be extending this feature in Grafana 8.0 to support smooth logs correlation not only from Prometheus, but also from Graphite metrics. Prometheus and Loki have almost the same query syntax, so transforming between them is very natural. However, Graphite syntax for queries is different, and in order to map it to Loki, some extra setup is required.

How shuffle sharding in Cortex leads to better scalability and more isolation for Prometheus

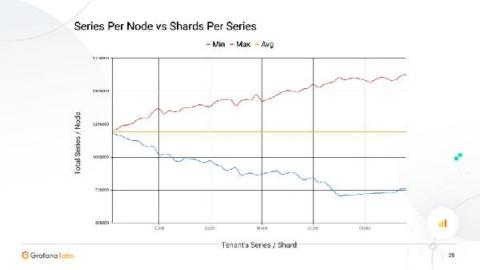
For many years, it has been possible to scale Cortex clusters to hundreds of replicas. The relatively simple Dynamo-style replication relies on quorum consistency for reads and writes. But as such, more than a single replica failure can lead to an outage for all tenants. Shuffle sharding solves that issue by automatically picking a random “replica set” for each tenant, allowing you to isolate tenants and reduce the chance of an outage.

The Grafana Enterprise Stack in less than 3 minutes

Grafana Labs is the open & composable observability company. In just over 6 years, our namesake product, Grafana, has become the world's #1 dashboarding service for time series data with over 6 million users. And we've been recognized as a leader in the space. Grafana Labs has built the world's first open & composable observability stack -- and it's natively designed for monitoring hybrid-cloud, container, and microservices environments.

How to search logs in Loki without worrying about the case

Whether it’s during an incident to find the root cause of the problem or during development to troubleshoot what your code is doing, at some point you’ll have an issue that requires you to search for the proverbial needle in your haystack of logs. Loki’s main use case is to search logs within your system. The best way to do this is to use LogQL’s line filters. However, most operators are case sensitive.

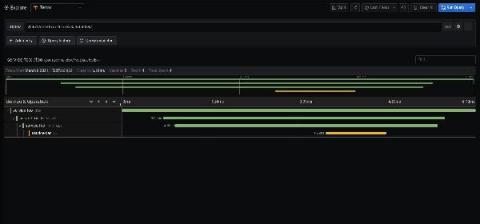
Get started with distributed tracing and Grafana Tempo using foobar, a demo written in Python

Daniel is a Site Reliability Engineer at k6.io. He’s especially interested in observability, distributed systems, and open source. During his free time, he helps maintain Grafana Tempo, an easy-to-use, high-scale distributed tracing backend. Distributed tracing is a way to track the path of requests through the application. It’s especially useful when you’re working on a microservice architecture.

What's new in Grafana Enterprise Metrics 1.3, our scalable, self-hosted Prometheus service

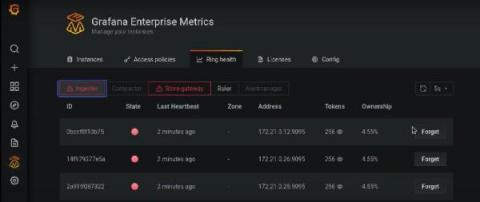
We built Grafana Enterprise Metrics (GEM) to empower centralized observability teams to provide a multi-tenanted, horizontally scalable Prometheus-as-a-Service experience for their end users. The GEM plugin for Grafana is a key piece of realizing this vision. It provides a point-and-click way for teams operating GEM to understand the state of their cluster and manage settings for each of the tenants within it.

Get instant Grafana dashboards for Prometheus metrics with the Elixir PromEx library

I have been using Grafana for almost four years now, and in that time it has become my go-to tool for my application observability needs. Especially now that Grafana allows you to also view logs and traces, you can easily have all three pillars of observability surfaced through Grafana. As a result, when I started working on the Elixir PromEx library, having Grafana be the end target for the metrics dashboards made perfect sense.

Benchmarking Grafana Enterprise Metrics for horizontally scaling Prometheus up to 500 million active series

Since we launched Grafana Enterprise Metrics (GEM), our self-hosted Prometheus service, last year, we’ve seen customers run it at great scale. We have clusters with more than 100 million metrics, and GEM’s new scalable compactor can handle an estimated 650 million active series. Still, we wanted to run performance tests that would more definitively show GEM’s horizontal scalability and allow us to get more accurate TCO estimates.