Operations | Monitoring | ITSM | DevOps | Cloud
How to navigate data with Content Outline
The Grafana developer portal: your gateway to enhanced plugin development
As Grafana continues to evolve, we remain dedicated to improving the experience for Grafana users, as well as the developers building applications on top of the platform. Today, we are delighted to introduce the next step in that evolution, the all-new Grafana developer portal — a central hub of curated resources for developers who want to extend Grafana’s capabilities.
The benefits of web performance testing with Grafana k6 browser and Grafana Faro
Performance tests created with the Grafana k6 browser module use lab data collected from pre-defined environments, devices, and network settings. Lab data allows you to repeatedly reproduce performance results, making it useful for detecting and fixing performance issues early. Lab data, however, doesn’t account for one very important testing component: real user experience.
Grafana 10.2 release: Grafana panel title generator, interactive visualizations, and more
Grafana 10.2 is here! Download Grafana 10.2 As always, the latest version of Grafana includes a ton of dashboard and data visualization improvements. You can add interactive buttons to your Canvas visualizations; auto-generate dashboard panel titles, and descriptions using AI; and zoom in on specific y-axis values in your time series.
How Flexcity used Grafana Cloud to help balance the national power grid in France
Last winter, Flexcity — a market leader in electric flexibility — faced an unprecedented challenge: Help stabilize the French national power grid, in the midst of a widespread energy crisis that loomed over Europe. As a byproduct of the Russian invasion of Ukraine, energy prices in the EU soared in 2022. And France, meanwhile, faced a nuclear power outage that winter that threatened to significantly disrupt its energy supply and increase the risk of electricity shortages.
New in Grafana k6: The latest OSS features in v0.47.0 and more efficient performance testing in Grafana Cloud k6
Grafana k6 v0.47.0 has been released, featuring gRPC’s binary metadata support, new authentication methods, and tons of other improvements for Grafana k6 OSS. Here’s a quick overview of the latest features in Grafana k6 v0.47.0, as well as some other exciting updates related to Grafana Cloud k6 and the k6 community.
Kubernetes cost optimization: tips for a more efficient operation
Kubernetes offers unparalleled flexibility and scalability for containerized orchestration. However, this dynamism can also lead to unexpected costs if you don’t efficiently manage your corresponding cloud resources. In this blog, we’ll outline a series of best practices for Kubernetes cost optimization that will help you keep your infrastructure running smoothly while staying within your budget.
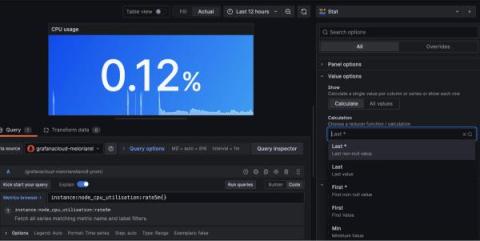
How to easily retrieve values from a range in Grafana using a stat panel
Grafana is an open source visualization and monitoring solution for correlating and analyzing data from various sources. From time series graphs to heatmaps to 3D charts, it gives you lots of ways to untangle complex datasets. And while that’s incredibly powerful for observability, sometimes you’re looking for something fairly straightforward.
Reproducing and testing distributed system failures with xk6-disruptor
Distributed systems, such as modern microservices-based applications, are highly scalable, but also highly complex. Dependencies and unexpected interactions between services are a common cause of incidents, and these incidents are also notoriously hard to test for. xk6-disruptor — an extension that adds fault injection capabilities to Grafana k6, the open source reliability and load testing tool — can help overcome these challenges.


