Operations | Monitoring | ITSM | DevOps | Cloud

APM

The latest News and Information on Application Performance Monitoring and related technologies.

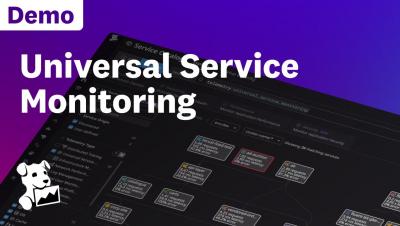
Datadog Universal Service Monitoring Demo

See how you can get instant visibility into the health of your entire fleet of services—without requiring you to change a single line of code. By automatically discovering, mapping, and monitoring every service and dependency, Universal Service Monitoring allows you to detect issues faster, monitor service performance and SLOs across entire environments, and centralize all the knowledge about your services in a single place.

Challenges in Choosing an APM tool for Fintech Companies in India due to RBI Guidelines

As the growth lead of an open-source APM tool, I keep interacting with developers from companies of all shapes and sizes. I recently talked with a developer from a fintech startup in India. The startup provides a payment processing platform that enables businesses to accept payments from customers worldwide. For them, monitoring is critical, but the dev shared how limited they were when exploring an APM tool for their application. The reason? Reserve Bank of India.

Exciting New Additions to the eG Enterprise Mobile Application

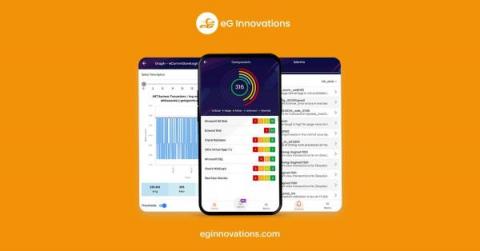
Our latest release of eG Enterprise, version 7.2 is accompanied by significant enhancements and new features for our popular eG Enterprise mobile app for iOS and Android. These apps allow administrators to access the eG Enterprise administrator console on the go and receive meaningful alerts and push notifications with click throughs to deep diagnosis rather than dumb text messages.

Retrace Logging Benefits

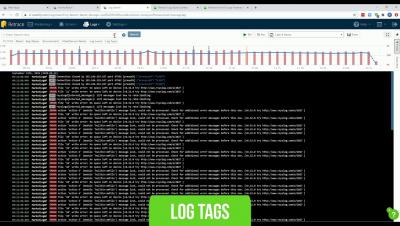
More than just APM, Logs inside of trace requests. Centralised Logging allows logs from many sources such as servers, files, applications all into Retrace. Search for log, go straight into trace. Tagging allows to group logs (based on client, developer etc.). Search and filter with any text, tag, regular expression. Save searches. Retrace allows unlimited users, all users can use saved searches. Live Tailing - what's going on the servers at any one time

The Three Pillars of Observability: Metrics, Logs and Traces

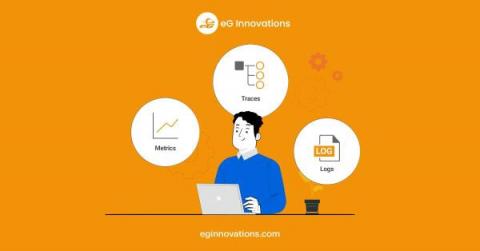
Metrics, Logs and Traces are often referred to as The Three Pillars of “Observability“. The term observability has been used in control theory to refer to how the state of a system can be inferred from the system’s external outputs. Applied to IT, observability is how the current state of an application can be assessed based on the data it generates. Applications and the IT components they use provide outputs in the form of metrics, events, logs and traces (MELT).

Monitoring your Express application using OpenTelemetry

Nodejs is a popular Javascript runtime environment that executes Javascript code outside of a web browser. Express is the most popular web frameworks that sits on top of Nodejs and adds functionalities like middleware, routing, etc. to Nodejs. You can monitor your express application using OpenTelemetry and a tracing backend of your choice.

Monitor your Nodejs application with OpenTelemetry and SigNoz

OpenTelemetry can auto-instrument many common modules for a Javascript application. The telemetry data captured can then be sent to SigNoz for analysis and visualization. OpenTelemetry is a set of tools, APIs, and SDKs used to instrument applications to create and manage telemetry data(Logs, metrics, and traces). For any distributed system based on microservice architecture, it's an operational challenge to solve performance issues quickly.