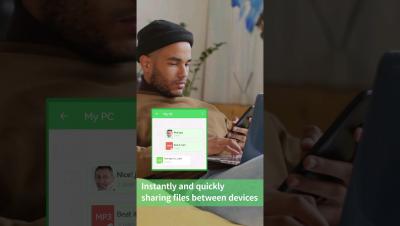
Operations | Monitoring | ITSM | DevOps | Cloud

DORA metrics: Where are you on the journey? @Sleuth TV

We're wrapping up Season 1 of Sleuth TV Live! We've covered a lot of ground, so we'll pull it all together with a talk about the DORA metrics journey and where you can go from here. In episode 6 of Sleuth TV Live, Sleuth's CTO Don Brown and Head of Customer Success Leigh Ann Whitmarsh discussed four levels along the DORA metrics journey, with tips and real-life examples of the opportunities available to maximize your investment in DORA metrics.

Troubleshooting SaaS User Experiences with AppNeta from Broadcom Software

Many organizations are moving to SaaS-based hosting environments but how do you monitor the user experience of these apps when they no longer exist within the four walls of your data center? In this demo, we are going to reveal how network operations teams can gain true visibility into the user experience with AppNeta from Broadcom Software - even when they do not own any of the network infrastructure delivering that experience.

Understanding the Observability Maturity Model

Based on research and conversations with enterprises from various industries, StackState created the Observability Maturity Model. This model defines the four stages of observability maturity. The ultimate destination is level four, Proactive Observability with AIOps. However, even moving from level one to two, or from level two to three, is a huge improvement in your ability to get essential insights into your IT environment.