Operations | Monitoring | ITSM | DevOps | Cloud

Latest Videos

Checkly Changelog: New Features and Updates - Traces, Visual Regression Checks, and Degraded States

Join María and Nočnica as we go over three major new features from Checkly: Checkly Traces - integrate OpenTelemetry data from your stack with synthetic monitoring traces Visual Regression Checks - Check for pixel-by-pixel changes to your website Degraded Checks - want to note a problem but don't want it to trigger alerts like a failing check? Try soft assertions and the 'degraded' state.

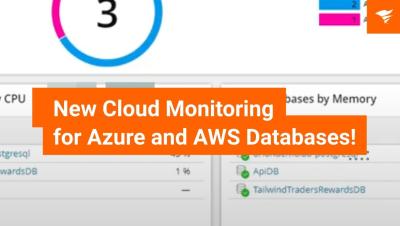
SolarWinds Observability Self Hosted 2024.4: New Cloud Monitoring for Azure and AWS Databases!

Explore the powerful new features in SolarWinds version 2024.4, now supporting expanded cloud monitoring capabilities! Crystal Taylor, SolarWinds Evangelist, walks you through the latest updates, including Azure Managed Instance, Azure MySQL, Azure PostgreSQL, and Amazon RDS for SQL Server. See firsthand how PostgreSQL and RDS instances are monitored, showcasing detailed charts and metrics like Log IOs, physical data reads, and memory usage. Upgrade now to take full advantage of these new insights and optimize your cloud database performance.

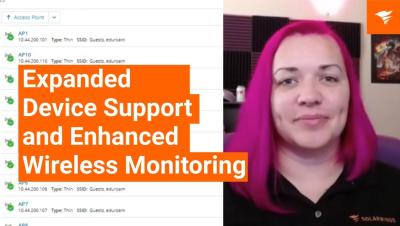
SolarWinds Observability Self Hosted 2024.4 Expanded Device Support and Enhanced Wireless Monitoring

Discover the latest features in SolarWinds version 2024.4! This update brings support for a variety of new network devices, including Fortinet SD WAN, Ruckus, Juniper, Arista, and Extreme Networks wireless access points, plus Meraki switch support via API integration. Join Crystal Taylor, SolarWinds Evangelist, as she takes you through the new wireless monitoring capabilities and shows how your network management just got easier. Watch now to optimize your network oversight and stay ahead with these powerful enhancements!

GitLens - Streamline Collaboration

Streamline Collaboration | Access Work Anywhere & Suggest Changes Easily and securely share code changes with your teammates or other developers by creating a Cloud Patch from your WIP, commit or stash and sharing the generated link. Liberate your code reviews and make and receive code suggestions from your team on anything in your project, not just on the lines of code changed in the PR.

GitLens - Interactive Code History

Blame, Hovers, and Commit Graph | Actionable Visuals Go beyond just visualizations with actionable commands. Create branches, rebase, revert, and more by simply right clicking within your repo’s history with the GitLens Commit Graph. The only graph with rich search capabilities, search by a specific commit, message, author, a changed file or files, or even a specific code change.

Booking.com's Observability Overhaul: Unified Metrics, Logs, and User Insights | Grafana & OTel

Murugesan and Ahmadali from Booking.com's Observability Team as they dive into the journey of modernizing observability. Discover how they transformed fragmented systems into a centralized, scalable platform using OpenTelemetry and Grafana solutions. They share insights on their three-year strategy, the importance of unified metrics and logs, and overcoming challenges, from technology transitions to fostering teamwork.

Implementing Clean Architecture in Next.js

In this workshop you’ll get a deep dive into Clean Architecture and answer the questions: What is Clean Architecture? What problems does it solve? How to implement Clean Architecture in Next.js? You will also learn how to use Sentry to instrument your backend and see how you can use the Trace View to identify performance issues in your application.

Beginners guide - Visualizing Canvas in Grafana | Grafana Labs

In this video, Grafana Developer Advocate Leandro Melendez describes how Canvas panels combine the power of Grafana with the flexibility of custom elements. They are extensible visualizations that allow you to add and arrange elements wherever you want within unstructured static and dynamic layouts. This lets you design custom visualizations and overlay data in ways that aren’t possible with standard Grafana visualizations, all within the Grafana UI.