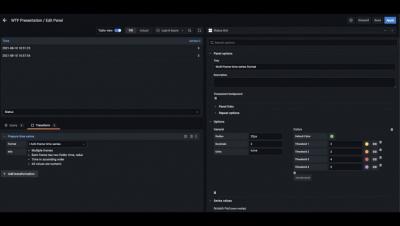
The wide time series format was introduced in Grafana 7.5, and has been the standard for time series data since. This new format does not work well with older panels though. WTF? Learn how to spot time series format issues, and solve them. Presented by Stephanie Closson, Software Engineer at Grafana Labs at Grafana East Coast Virtual Meetup - August 2021
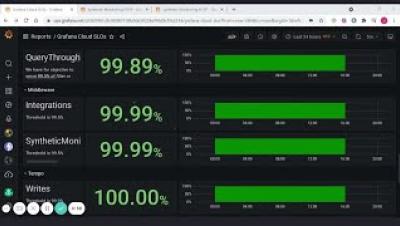
Identifying the right the right Service-Level Indicators is mission-critical for any SRE team responsible for meeting Service-Level Objectives and reporting on them. Find out how to sift through mountains of metrics and fill gaps in your data in order to visualize SLIs that actually matter for effective error budget tracking and actionable alerts in Grafana. Presented by: Jacob Plicque III, Senior Engineer at Grafana Labs at Grafana East Coast Virtual Meetup - August 2021
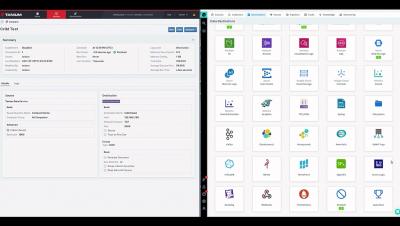
Tanium Connect and Cribl LogStream are a natural fit. They allow Tanium users to send data to a constantly growing list of destinations. LogStream also provides an on-premises and a cloud-based offering that can be used in production workflows. And you can process up to 5 TB of on-prem data per day – or up to 1 TB of cloud data per day – absolutely free. Watch what you can do with Tanium and Cribl LogStream together in this short demo.
How has IT management evolved over the years, what digital transformation have we seen over the last few years & the influence of Automation and AI. Make sure to follow for new episodes!
This tutorial helps first-time users on how to set up an NGINX source in the Kubernetes environment easily. Learn how to analyze NGINX performance, monitor complex transactions, track usage patterns, and track key logs and metrics, using the NGINX for Kubernetes sources.
When you’re new to an industry, you encounter § a lot of new concepts. We tend to use a lot of jargon, the documentation may be written for someone more experienced in mind or rely on contextual knowledge of the rest of the space, and it often doesn’t explain the “why” for the tool. This can make it really difficult to get your feet underneath you in an unfamiliar landscape, especially for junior engineers.
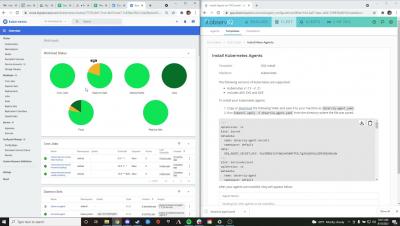
A quick demonstration of an observIQ log management agent installation on Kubernetes. Install and ship logs to your observIQ Cloud log management account in thirty seconds!
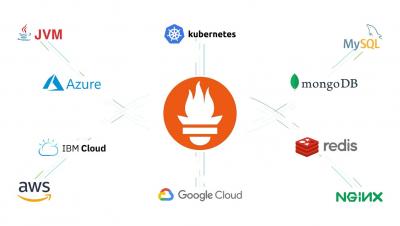
Prometheus is the de-facto standard for monitoring Kuberentes and cloud-native applications. However, as your Prometheus environment grows, it gets more and more complicated to use and maintain. Prometheus exporters need to be selected, installed, configured, and updated. And PromQL has a steep learning curve. How can you focus on your business, instead of building a monitoring solution?