Operations | Monitoring | ITSM | DevOps | Cloud

The Place Where Modern Operations & Technology Come Together

Latest Videos


Become a Kibana Search Expert - Part 1
Part 1 of a 2-part webinar series on understanding Kibana querying.

Using the Right Tool for the Job - SolarWinds Lab Episode #66
In this episode, Senior Manager of Product Strategy Chris O'Brien is joined by Head Geeks™ Patrick Hubbard and Leon Adato to explore better tools you can use for sophisticated monitoring challenges - challenges like Cisco® Nexus devices and automated mapping. The solution are techniques that offer both depth of functionality and scalability. You won't want to miss this!

What is OpsGenie
OpsGenie is a modern incident management platform for operating always-on services, empowering Dev & Ops teams to plan for service disruptions and stay in control during incidents. With over 200 deep integrations and a highly flexible rules engine, OpsGenie centralizes alerts, notifies the right people reliably, and enables them to collaborate and take rapid action.
Move to the Cloud with OpsGenie
Adopting cloud technology to operate always on services improves customer experience lowers overheard and increases speed of innovation. Learn how OpsGenie's modern incident management platform is essential to your success.
Logs are Not Human Scale: How to Build Observable Systems
Sam Stokes speaks at the O'Reilly Software Architecture conference in New York about how to build observable systems.
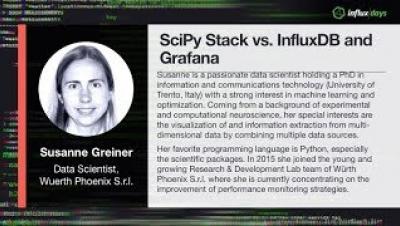
SCIPY STACK VS. INFLUXDB AND GRAFANA
Scientific python programmers adore Pandas due to its many functionalities. In particular, for data manipulation and analysis it offers handy data structures and operations for numerical tables and time series. Combined with the rest of the SciPy stack and scikit-learn (e.g. for Machine Learning Analysis), multiple goals can be achieved. When it comes to on-line data analysis, interaction, or simple data navigation by multiple users, the SciPy stack can be stressed to its limits.
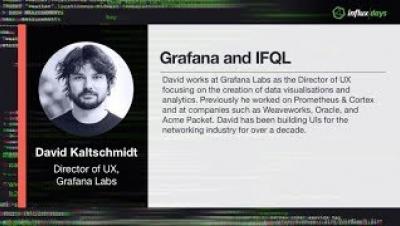
GRAFANA AND Flux
The new Flux (formerly IFQL) super-charges queries both for analytics and data science. David gave a quick overview of the language features as well as the moving parts for a working deployment. Grafana is an open source dashboard solution that shares Flux’s passion for analytics and data science. For that reason, they are very excited to showcase the new Flux support within Grafana, and a couple of common analytics use cases to get the most out of your data.
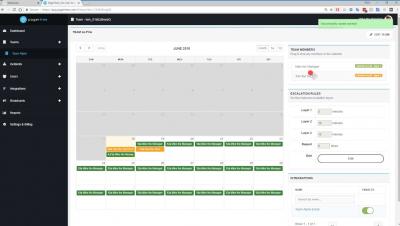
Getting Started with PagerTree (Demo)
PagerTree on-call incident management gives teams flexible schedules, escalations, & reliable notifications via email, SMS, voice, chatbots, & smartphone app.

CHRONOGRAF PRESENT AND FUTURE
Chronograf is the visualization tool for the TICK Stack that makes getting started with your Time Series Database easy. Tim will share best practices around using templates and libraries with Chronograf as well as share some exciting roadmap updates.