Artifactory is not just any package manager. It’s the industry standard repository for software package management. Listen to Yoav Landman, JFrog CTO, and co-founder, explain this powerful tool.
In this video, we will see how to create a new project, assign a project admin, create repositories within the project, and how to handle roles and members’ permissions. By Shani Attias - JFrog support
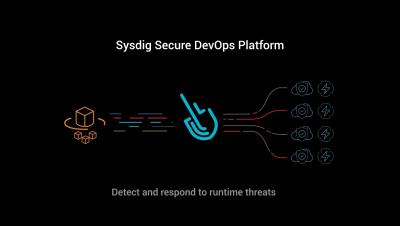
Thanks to serverless you can focus on your apps, instead of your infrastructure. Take AWS Fargate as an example. A service where you can deploy containers as Tasks, without worrying what physical machine they run on. However, without access to the host How can you detect suspicious activity? Like, file changes on your Fargate tasks? Sysdig provides runtime detection and response to secure Fargate serverless containers.
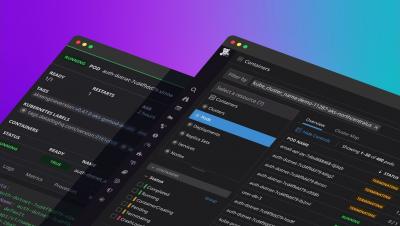
Datadog Live Containers provides multidimensional, real-time visibility into Kubernetes workloads, from Deployments and ReplicaSets down to individual Containers. Using Datadog's curated metrics, teams can track the health and performance of their Kubernetes resources in the appropriate context and surface critical information about every layer of their Cluster.
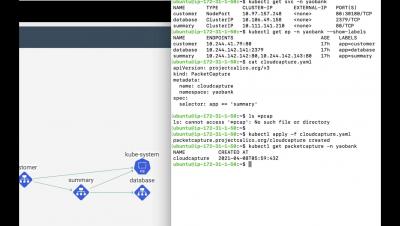
Downtime is expensive and applications are a challenge to troubleshoot across a dynamic, distributed environment consisting of Kubernetes clusters. While development teams and service owners typically understand the microservices they are deploying, it’s often difficult to get a complete, shared view of dependencies and how all the services are communicating with each other across a cluster. Limited observability makes it extremely difficult to troubleshoot end-to-end connectivity issues which can impact application deployment.
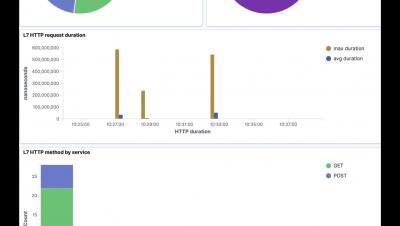
The majority of operational problems inherent to deploying microservices in a distributed architecture are linked to two areas: networking and observability. At the application layer (Layer 7), the need to understand all aspects associated with service-to-service communication within the cluster becomes paramount. Service-to-service network traffic at this layer is often using HTTP. DevOps teams struggle with these questions: Where is monitoring needed? How can I understand the impact of issues and effectively troubleshoot? And how can I effectively protect application-layer data?
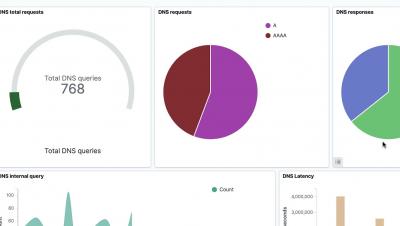
While it’s an essential part of Kubernetes, DNS is also a common source of outages and issues in Kubernetes clusters. Debugging and troubleshooting DNS issues in Kubernetes environments is not a trivial task given the limited amount of information Kubernetes provides for DNS queries. The DNS Dashboard in Calico Enterprise and Calico CLoud helps Kubernetes teams more quickly confirm or eliminate DNS as the root cause for microservice and application connectivity issues.
As infrastructure modernizes, it becomes more complex and more difficult to monitor and operate. To truly understand what your systems are doing, you need full-stack, end-to-end observability. We built Splunk Observability Cloud to eliminate your blind spots and go from alert to problem resolution in seconds–not hours. Splunk Observability Cloud provides one unified experience for seamless monitoring, troubleshooting, and resolution across any stack, at any scale.
Log analysis is a key part of getting answers from your stack, and Splunk Log Observer, part of the Splunk Observability Cloud, is built for fast, powerful log analysis. Trust the industry-leading expert on logs to help you draw insights fast from any volume of data, in real-time, without having to write any queries by hand.