Today we’re proud to announce the general availability of Relay, a cloud-native workflow automation platform. We launched our public beta of Relay last June, and we’re now officially out of beta and open for business! We’ve been pretty busy during the beta period - early users have executed thousands of workflows, processed tons of events, and given us incredibly helpful feedback.
Grafana is a popular way of monitoring and analysing data. You can use it to build dashboards for visualizing, analyzing, querying, and alerting on data when it meets certain conditions. In this post, we’ll look at an overview of integrating data sources with Grafana for visualizations and analysis, connecting NoSQL systems to Grafana as data sources, and look at an in-depth example of connecting MongoDB as a Grafana data source.
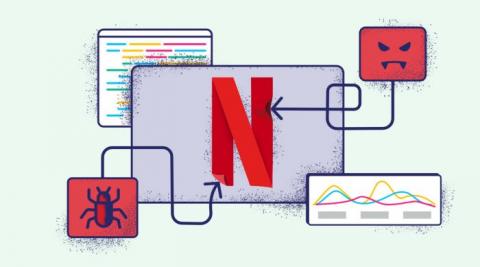
Distributed systems such as microservices have defined software engineering over the last decade. The majority of advancements have been in increasing resilience, flexibility, and rapidity of deployment at increasingly larger scales. For streaming giant Netflix, the migration to a complex cloud based microservices architecture would not have been possible without a revolutionary testing method known as fault injection. With tools like chaos monkey, Netflix employs a cutting edge testing toolkit.
Trying to work out the best security tool is a little like trying to choose a golf club three shots ahead – you don’t know what will help you get to the green until you’re in the rough. Traditionally, when people think about security tools, firewalls, IAM and permissions, encryption, and certificates come to mind. These tools all have one thing in common – they’re static.
All networks, no matter how sophisticated, are vulnerable to attack from outsiders. They can also face compromise from poor program integration, outdated software, lagging connections, and insufficient bandwidth. These issues impede the efficiency of your workforce and can frustrate clients who depend on reaching you through reliable communication methods. A technologically advanced network needs constant attention to run at peak efficiency.
In this post, we are going to look at different tools and strategies for Network Performance Monitoring. To follow along with this blog article, make sure to book a demo and sign up for MetricFire's free trial where a lot of our customers are doing network performance monitoring using Hosted Graphite and Prometheus service. These tools are part of MetricFire’s offering.
We are happy to announce the immediate availability of Spring 2021 update to the Alloy Software ITSM/ITAM platform, including Navigator, Navigator Express, and Discovery. This maintenance release (8.7.4) offers stability and usability improvements, resolves issues with external tool integrations in Discovery and Network Inventory, and addresses several issues reported in earlier versions. For detailed information about all changes in this update, please see Release Notes for your product.
Since the release of CVE-2020-8554 on GitHub this past December, the vulnerability has received widespread attention from industry media and the cloud security community. This man-in-the-middle (MITM) vulnerability affects Kubernetes pods and underlying hosts, and all Kubernetes versions—including future releases—are vulnerable. Despite this, there is currently no patch for the issue.