Operations | Monitoring | ITSM | DevOps | Cloud

Latest Posts

How to install Datadog on AWS hosts with Ansible dynamic inventories

Ansible is an automation tool for provisioning, managing, and deploying infrastructure and applications. When building large-scale applications, Ansible enables users to manage and configure their infrastructure across platforms like AWS. Whether you rely on temporary or dedicated hosts, you can use Ansible to create a repeatable process for configuring them with the Datadog Agent.

Monitor Apache Ambari with Datadog

Apache Ambari is an open source management tool that helps organizations operate Hadoop clusters at scale. Ambari provides a web UI and REST API to help users configure, spin up, and monitor Hadoop clusters with one centralized platform. As your Hadoop deployment grows in size and complexity, you need deep visibility into your clusters as well as the Ambari servers that manage them. If issues arise in Ambari, it can lead to problems in your data pipelines and cripple your ability to manage clusters.

Unify logs across data sources with Datadog's customizable naming convention

Log management solutions can make it easy to filter, aggregate, and analyze your log data. Whether you leverage JSON format or process your logs in order to extract attributes, you can slice and dice your logs using the information they provide such as timestamp, HTTP status code, or database user. But different technologies and data sources often label similar information differently, making it difficult to aggregate data across multiple sources.

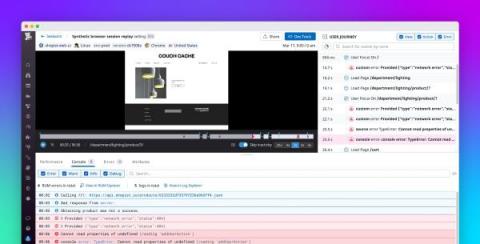
Monitor JavaScript console logs and user activity with Datadog

Monitoring backend issues is critical for ensuring that requests are handled in a timely manner, and validating that your services are accessible to users. But if you’re not tracking client-side errors and events to get visibility into the frontend, you won’t have any idea how often these issues prompt users to refresh the page—or worse, abandon your website altogether.

Introducing Metrics from Logs and Log Rehydration

As your application grows in size and complexity, it becomes increasingly difficult to manage the number of logs it generates and the cost of ingesting, processing, and analyzing them. Organizations often have little control over fluctuations in the volume of logs generated—and the resulting costs of collecting them—so they are forced to limit the number of logs generated by their applications, or to pre-filter logs before sending them to their log management platform.

Introducing Datadog Network Performance Monitoring

Network Performance Monitoring is currently available in private beta. Request access here. Your applications and infrastructure components rely on one another in an increasingly complex fabric, regardless of whether you run a monolithic application or microservices, and whether you deploy to cloud infrastructure, private data centers, or both.

Dash 2019: Guide to Datadog's newest announcements

At Dash 2019, we are excited to share a number of new products and features on the Datadog platform. With the addition of Network Performance Monitoring, Real User Monitoring, support for collecting browser logs, and single-pane-of-glass visibility for serverless environments, Datadog now provides even broader coverage of the modern application stack, from frontend to backend.

Signal Sciences brings real-time web attack visibility to Datadog

Signal Sciences is proud to announce our integration with the Datadog platform. This integration furthers our mission of producing the leading application security offering that empowers operations and development teams to proactively see and respond to web attacks—wherever and however they deploy their apps, APIs, and microservices.

Automate workflows with Datadog's Amazon EventBridge integration

Amazon EventBridge is a serverless event bus that routes real-time data streams from your applications and services to targets like AWS Lambda. EventBridge facilitates event-driven application development by simplifying the process of ingesting and delivering events across your application architecture, and by providing built-in security and error handling. We are excited to announce that you can now use our new integration to route Datadog alerts to EventBridge with minimal configuration or setup.

Cross-tenant monitoring with Azure Lighthouse and Datadog

Azure Lighthouse is a new feature that provides improved access management for users and applications across different Azure tenants. With Azure Lighthouse, managed service providers (MSPs) can manage their customers’ environments more easily and efficiently than ever before. Datadog is proud to announce support for Azure Lighthouse, which ensures that MSPs can implement a streamlined, scalable approach to monitoring their customers’ Azure environments.