Operations | Monitoring | ITSM | DevOps | Cloud

Latest Posts

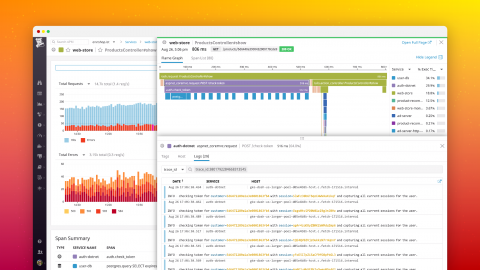
Troubleshoot .NET apps with auto-correlated traces and logs

Collecting observability data like metrics, traces, and logs makes it much easier to identify bottlenecks and other performance problems in your .NET applications. When you need to troubleshoot a production incident, it’s especially important to be able to navigate all that data so you can find the source of the issue and enact a timely resolution.

How to monitor Google Kubernetes Engine with Datadog

Google Kubernetes Engine (GKE), a service on the Google Cloud Platform (GCP), is a hosted platform for running and orchestrating containerized applications. Similar to Amazon’s Elastic Container Service (ECS), GKE manages Docker containers deployed on a cluster of machines. However, unlike ECS, GKE uses Kubernetes, an increasingly popular open source orchestrator that can deploy, schedule, and scale containers on the fly.

Integrate Akamai mPulse real user monitoring with Datadog

Akamai mPulse is a real user monitoring (RUM) service that enables organizations to get deep visibility into end user experience across their websites or applications. With mPulse, businesses can collect high-granularity metrics directly from their users’ browsers, and then analyze that data to pinpoint slow resources (e.g., third-party scripts), track user engagement, and make decisions to improve the performance of their products.

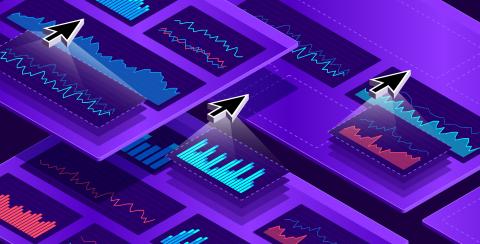
Copy and paste widgets to share data across teams and dashboards

As your environment grows in scale and complexity, finding faster ways to build rich dashboards and share strategic insights with the right team members becomes more important. To help you easily share data with anyone, anywhere, we are happy to announce that you can now copy and paste widgets within Datadog (across dashboards, Notebooks, and accounts)—and even in emails and other communication channels like Slack.

Monitor Harbor container registry with Datadog

Harbor, developed by VMware and hosted by the CNCF, is an open source registry for container images and Helm charts. Hosting Harbor within your infrastructure gives you a number of advantages over using the default Docker registry, such as role-based access control, security scanning, and replication of resources between registry instances. Since a failed Harbor deployment can spell trouble for your containerized workloads, monitoring your self-hosted container registry is critical.

A look back at Dash 2019: Two days of talks, workshops, and community

Thanks to all who attended our second annual Dash conference! We hope that you enjoyed your time with us at New York City’s Chelsea Piers, and that you were able to learn about building and scaling systems and teams in our breakout sessions and workshops. For those of you who were unable to attend, we hope to see you next year. Check out some of the highlights from our two-day conference below.

Monitor your customer data infrastructure with Segment and Datadog

This is a guest post by Noah Zoschke, Engineering Manager at Segment. Segment is the customer data infrastructure that makes it easy for companies to clean, collect, and control their first-party customer data. At Segment, our ultimate goal is to collect data from Sources (e.g., a website or mobile app) and route it to one or more Destinations (e.g., Google Analytics and AWS Redshift) as quickly and reliably as possible.

Monitor Apache Hive with Datadog

Apache Hive is an open source interface that allows users to query and analyze distributed datasets using SQL commands. Hive compiles SQL commands into an execution plan, which it then runs against your Hadoop deployment. You can customize Hive by using a number of pluggable components (e.g., HDFS and HBase for storage, Spark and MapReduce for execution). With our new integration, you can monitor Hive metrics and logs in context with the rest of your big data infrastructure.

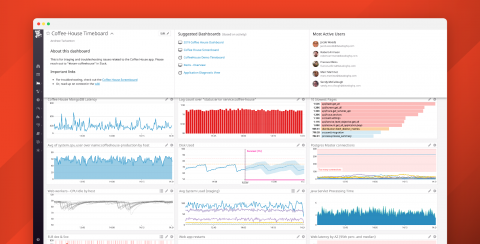
Understand, explore, and collaborate with Dashboard Details

Dashboards provide critical visibility into the performance and health of your environment. But if your organization uses hundreds or thousands of dashboards, or if you’ve recently transitioned to a new company or different team, it’s not always easy to understand the full significance of the data shown on every single dashboard.