Operations | Monitoring | ITSM | DevOps | Cloud

Latest Posts

Understand your Kubernetes and ECS spend with Datadog Cloud Cost Management

Rising container usage has fueled a growing reliance on container orchestration systems such as Kubernetes, EKS, and ECS. As organizations increasingly opt to run these systems in the cloud, their cloud spend tends not only to grow but also to become more opaque due to the dynamic complexity of these environments. Typically, various services, teams, and products share cluster resources, and as nodes are added and removed, those resources continuously shift.

React quickly to cost overruns with Cost Monitors for Datadog Cloud Cost Management

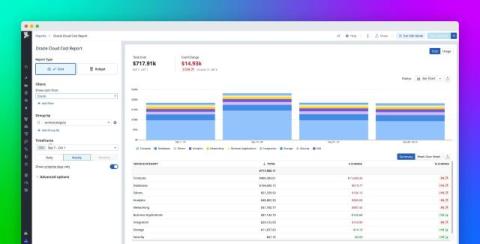
The dynamic nature of cloud costs can make it difficult to fully understand your cloud spend and embrace cost ownership at all levels of your organization. To establish cost governance, FinOps teams need a complete view of cloud costs, including allocation by team, service, and product. And DevOps teams need to detect, investigate, and quickly mitigate unexpected costs to minimize overruns, even as they continue to build features and operate their services.

Apply real-time updates to Datadog components with Remote Configuration

Datadog provides you with a comprehensive and highly customizable platform for monitoring the performance and security of your applications. Through Datadog components deployed in your environment—including the Agent, tracing libraries, and Observability Pipelines workers—you can easily configure monitoring across your hosts and services, regardless of the particular technology you’re using.

Automate end-to-end processes and quickly respond to events with Datadog Workflow Automation

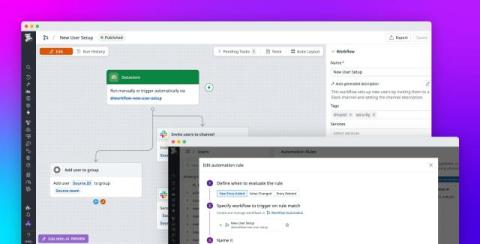
Developer, SRE, IT, and security teams often perform complex and error-prone processes in response to disruptions and changes in their systems. Relying on these processes requires a significant amount of time switching between tools to gather the relevant context needed for remediation, domain expertise, and the manual execution of tasks for incident management—which can significantly prolong disruptions and downtime.

Streamline your CI testing with Datadog Intelligent Test Runner

Modern continuous integration (CI) practices enable development teams to quickly and efficiently build and deploy application code to a shared codebase. However, deploying new code is typically accompanied by tests, and as the codebase expands, this results in a proportionately larger test suite.

Track changes to Datadog dashboards and notebooks with version history

Datadog dashboards and notebooks can be powerful tools for troubleshooting, enabling you to analyze telemetry from across your stack with visualizations customized by service owners, data analysts, and engineers. Many organizations also rely on dashboards and notebooks for key business processes, such as generating reports, creating postmortems, and managing SLOs. This makes it important to keep track of any unintended changes that may result from others accessing your content.

Monitor your firewall logs with Datadog

Firewall systems are critical for protecting your network and devices from unauthorized traffic. There are several types of firewalls that you can deploy for your environment via hardware, software, or the cloud—and they all typically fall under one of two categories: network-based or host-based. Network-based firewalls monitor and filter traffic to and from your network, whereas host-based firewalls manage traffic to and from a specific host, such as a laptop.

Gain visibility into your Cloudera clusters with Datadog

Cloudera Data Platform (CDP) is a data analytics and management platform that enables users to centralize, visualize, and govern their data. While users may be accustomed to data analytics solutions that are completely siloed and difficult to scale, CDP is designed to be flexible, giving customers the ability to integrate with open source technologies and deploy in a hybrid, cloud-native, or multi-cloud environment.

Automatically identify and efficiently investigate frontend issues with RUM Watchdog Insights

When your applications are experiencing degraded frontend performance, every minute of investigation counts towards minimizing the impact of regressions on your users. That’s why we built Watchdog Insights, an AI-powered recommendations engine that augments monitoring investigations by intelligently surfacing data that sheds light on outliers in the errors and latency affecting your applications.

Monitor Azure OpenAI with Datadog

Azure OpenAI is a service for deploying AI applications on Azure resources. With its easy-to-use REST APIs, you can leverage the service to access OpenAI’s powerful language models, such as ChatGPT, for your applications while taking advantage of the reliability and security of the Azure platform. Datadog already offers an out-of-the-box integration for OpenAI so you can monitor key performance trends, such as API usage patterns, token consumption, and more.