Operations | Monitoring | ITSM | DevOps | Cloud

Latest Posts

Centralize, triage, and track tickets with Datadog Case Management

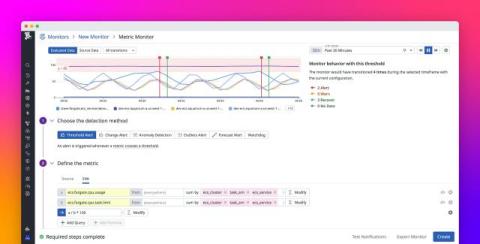
Complex systems require many different monitors to assess the health of their infrastructure and applications, creating a wealth of alerts that can be hard to track. Due to a lack of effective triage processes, many organizations page engineers for every alert that comes in, making it difficult to separate false positives from issues that actually require immediate attention.

Analyze the root causes and business impact of production issues with Trace Queries

Tracing provides indispensable insights into the state and performance of distributed applications, but it can often be difficult to determine the root cause or ultimate business impact of issues indicated by traces. Translating visibility of individual microservices into broader performance insights often requires drawing complex correlations between spans. This can be a laborious process, which can complicate everything from troubleshooting and triage to tracking KPIs and managing costs.

Quickly spot and revert faulty deployments with Change Overlays

Faulty deployments and other types of erroneous changes may account for around 70% of all application outages. With the prevalence of CI/CD workflows, engineering teams make changes to their applications, services, and infrastructure all the time, which can make it difficult to trace issues to specific changes.

Monitor Windows Performance Counters with Datadog

The Windows operating system exposes metrics such as CPU, memory, and disk usage as built-in performance counters, which provide a unified way to observe performance, state, and other high-level facets of Windows subsystems, components, and native or third-party applications. As such, Windows Performance Counters can be invaluable for monitoring resource usage and the health of your infrastructure, as well as systems your services are using.

Track and alert on Amazon CloudWatch Network Monitor metrics with Datadog

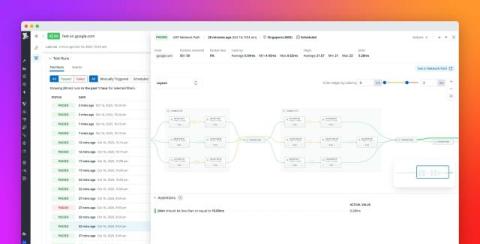
Amazon CloudWatch Network Monitor, available as part of Amazon CloudWatch, is a network monitoring service that enables you to create customizable monitors for your network connectivity from AWS to on-premises infrastructure via AWS Direct Connect (DX).

Monitor your OpenStack components with Datadog

OpenStack is an open source cloud platform that enables customers to provision and manage compute, storage, and networking resources via web-based dashboards or APIs. OpenStack offers a range of services beyond standard infrastructure-as-a-service functionality, including orchestration, fault management, and service management components. These components help customers build, maintain, and scale high-availability applications.

Visually replay user-facing issues with Zendesk and Datadog Session Replay

Zendesk provides support teams with an integrated solution for processing all types of customer inquiries and feedback. But as organizations scale, support tickets can multiply, making it difficult to parse customer feedback and investigate issues promptly and thoroughly. Customers often report problems without providing the detailed context needed for effective troubleshooting.

Monitor processes running on AWS Fargate with Datadog

Serverless platforms like AWS Fargate enable teams to focus on delivering value to customers by freeing up time otherwise spent managing infrastructure and operations. However, maintaining a deep level of observability into applications running on these fully managed platforms remains challenging.

Go memory metrics demystified

For engineers in charge of supporting Go applications, diagnosing and resolving memory issues such as OOM kills or memory leaks can be a daunting task. Practical and easy-to-understand information about Go memory metrics is hard to come by, so it’s often challenging to reconcile your system metrics—such as process resident set size (RSS)—with the metrics provided by the old runtime.MemStats, with the newer runtime/metrics, or with profiling data.

Troubleshoot streaming data pipelines directly from APM with Datadog Data Streams Monitoring

When monitoring applications with streaming data pipelines, there are additional complexities to consider that are not present in traditional batch-processing systems. Whether you’re using streaming data pipelines to power a digital trading platform, capture sensor data from an IoT device, or recommend news articles to users, it can be challenging to identify the root cause of delays when you’re dealing with distributed systems, real-time data, and the dynamic nature of events.