The latest News and Information on Distributed Tracing and related technologies.
Lumigo’s Auto-Tracing allows you to implement distributed tracing on your Lambda functions with 3-clicks and no manual code changes. If you’ve already decided to move to a serverless infrastructure, you probably understand the importance of monitoring your AWS Lambdas and what it might entail. For the few out there that are still wondering what monitoring AWS Lambda means, I’ll break it down for you in a couple of steps.
Monitoring began by using software agents to capture data from infrastructure, operating systems, and applications. These agents would collect metrics and events from these systems to understand the health of the underlying system and the applications. This is what infrastructure monitoring is today.
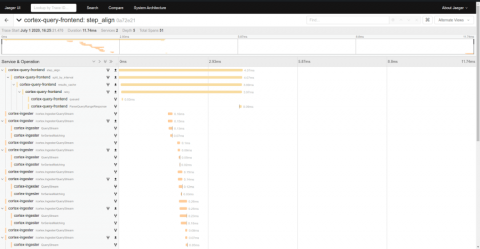
With microservices becoming popular, tracing is increasingly more important in debugging production software. In this post, we take you through a step by step guide on setting up Jaeger over Kubernetes with Cassandra storage.
In this article we are going to explain Jaeger integration with the OpenTelemetry collector, describe differences between these two and have a look at Kubernetes deployment via Jaeger Operator. OpenTelemetry collector is a vendor-agnostic service for receiving, processing and exporting telemetry data. In the Jaeger project we have decided to deprecate the Jaeger collector and migrate its functionality to an implementation based on OpenTelemetry collector.