Operations | Monitoring | ITSM | DevOps | Cloud

The latest News and Information on Monitoring for Websites, Applications, APIs, Infrastructure, and other technologies.

Distributed Tracing 101

The boom of digital commerce is making all businesses take a closer look at how they deliver great customer experiences. To stay competitive, businesses today are using cloud-native architectures, because the cloud-native applications they produce deploy quickly and better support the continuous improvement cycles of agile methodology. Behind the practicality of keeping online customers happy are distributed cloud environments that business applications use for each customer interaction.
Quickly identify client side errors and latency, with Splunk RUM

Splunk RUM (Real User Monitoring) helps software engineers quickly identify and isolate the most glaring client side performance issues, from errors to latency. Easily measure performance across your entire production environment, to specific services or applications, and seamlessly click into backend service performance.

Ask Miss O11y: Do I Need Observability If My Stack Is Boring?

Observability came out of microservices and cloud-native, right? If you have a simpler architecture, does o11y matter?” — this question came up during recent office hours Yeah, sort of. On both counts—yeah, it sorta came out of microservices and cloud native, and yeah sorta, you need it with a simpler architecture (though perhaps not as desperately as you otherwise might).

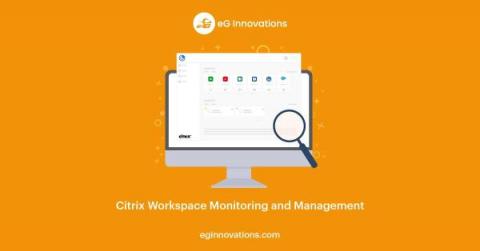
Citrix Workspace Monitoring and Management

This is another customer blog highlighting common customer scenarios that we typically see while working with large enterprise customers. There are many use cases in regard to a typical Citrix Digital Workspace environment where the endpoint is managed by a different team, outsourced to an external organization, or even unmanaged when employees work from home on a non-corporate device.

Full trace retention search comes to Grafana Cloud

This week we have turned on full trace retention search (beta) in Grafana Cloud Traces. This feature was also introduced in the recent release of Grafana Tempo v1.3. Previously, if you brought up your Grafana Cloud Traces data source, you were greeted with this message: This message simply warned the user that the Grafana Tempo search was calibrated for recent traces only, regardless of the selected time window.

G2 awards Sematext as high performer in Spring 2022 Reports

At Sematext, we are dedicated to making troubleshooting easier for ops teams. When we started to receive positive reviews from our customers around the globe, we knew we were doing something right. Even as our userbase grew across multiple industries, we continued to get positive feedback. We even received a few awards along the way. In this post, we’re delighted to announce that Sematext Cloud is featured in the G2 Spring 2022 Reports under Monitoring Software Solutions category as.

Parameterizing GitLab CI/CD?

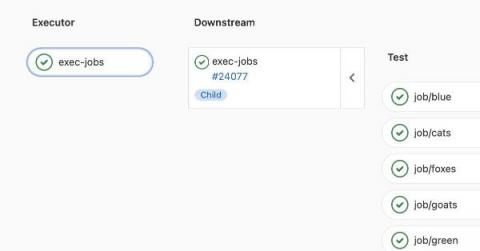
While doing packaging for Icinga, I noticed we have a lot of YAML files describing GitLab pipelines doing very similar jobs. The same build job across different operating systems. That’s wasteful behaviour, which leads to a bigger workload when it comes to modifying these jobs. Tasks like adding new versions and especially adding new operating systems become tedious. What I’m looking for is a way to have interchangeable values for our building jobs.