Operations | Monitoring | ITSM | DevOps | Cloud

The latest News and Information on Monitoring for Websites, Applications, APIs, Infrastructure, and other technologies.

You can now manage notification preferences via our API

Our service can detect various problems with your website: whenever it is down, or a broken link is detected, your cron job isn't running on time, and much much more. Whenever we see a problem we can notify you via email, Slack, webhooks, and various other channels. Up until now, you could configure these notification channels in our UI, but now you can do this via our API as wel.

Strategic Digital Employee Experience Management

With Nexthink Workplace Experience (built on the Nexthink Infinity platform) we introduced a next-generation DEX score (V3) along with an all-new product – Nexthink Experience Central – to deliver the strategic guidance Senior IT Leaders require to successfully enable and advance their company’s DEX strategy.

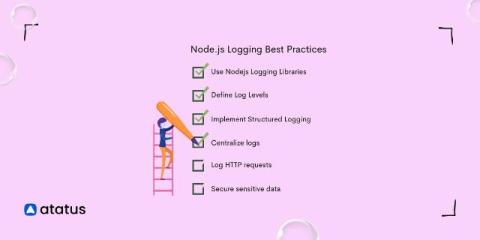
Node.js Logging Best Practices - A Complete Guide

Logging is essential in Node.js for tracking errors, monitoring performance, and debugging issues. Traditional node.js logging methods, like using console.log(), are often insufficient due to unstructured, cluttered logs that are hard to read. They lack features like log levels, proper formatting, and efficient storage management. Best practices for logging ensure logs are useful, structured, and manageable. Implementing these best practices is crucial for several reasons.

Harnessing AI for Cybersecurity: Beating AI Attackers at Their Own Game

In the rapidly evolving landscape of cybersecurity, AI-powered attackers are becoming increasingly sophisticated. To counter these threats, organizations must adopt advanced security technologies that leverage AI technology as part of a multi-layered approach to security.

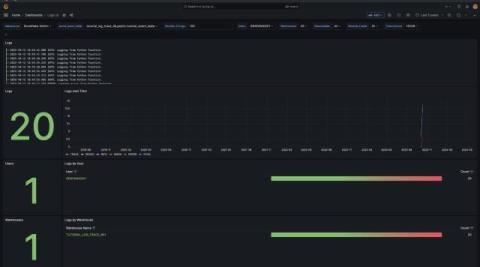
Snowflake data visualization: all the latest features to monitor metrics, enhance security, and more

In 2020, we introduced the Snowflake Enterprise data source plugin for Grafana, allowing users to seamlessly pull data from the Snowflake cloud-based data storage and analytics service into Grafana dashboards. Available for Grafana Enterprise and Grafana Cloud users, it’s a powerful way to not only query and visualize Snowlake data, but to do so alongside other data sources, so you can discover correlations and other meaningful insights within minutes.

6 tips to improve your Grafana plugin before you publish

Whether they help you tap into external data sources or add a new visualization type to your dashboard, plugins are a powerful way to customize and extend the value of Grafana. There’s a rich (and constantly evolving) ecosystem of Grafana plugins you can choose from today. While some of these plugins are created and maintained by the Grafana Labs team, many of them are contributed by our commercial partners and community members.

How to reduce expenses on monitoring: be smarter about data

Monitoring can get expensive due to the huge quantities of data that need to be processed. In this blog post, you’ll learn the best ways to store and process monitoring metrics to reduce your costs, and how VictoriaMetrics can help. This blog post will only cover open-source solutions. VictoriaMetrics is proudly open source. You’ll get the most out of this blog post if you are familiar with Prometheus, Thanos, Mimir or VictoriaMetrics.