Operations | Monitoring | ITSM | DevOps | Cloud

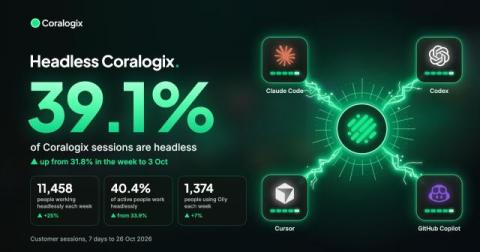
39% of Coralogix sessions are now headless

We set out to understand how customers were using Coralogix from outside the web app. Olly answers questions about a system in plain language. Coding agents query logs, examine traces, read metrics and configure the platform through the Coralogix CLI and MCP server. We wanted to see how much of this was becoming part of everyday work. In the week of 20–26 October, 39% of Coralogix sessions included Olly, the CLI or MCP.

Meet the new Explore: every question, one place

From the first alert to the root cause, without leaving the page. TL;DR: Investigating an incident is a series of quick questions, each one leading to the next. Until now, Explore made you stop between questions to translate them into syntax, switch modes or rebuild a chart. The new Explore lets you go straight from one question to the next: one workspace, any dataset, any team, any way you like to ask. Here’s what that looks like on a real night on call.
Elastic is a Strong Performer in The Forrester Wave for AIOps Platforms, Q4 2026

Open architecture, explainable AI, and full context Elastic was named a Strong Performer in The Forrester Wave: AIOps Platforms, Q4 2026, which evaluated 10 providers across 24 criteria. Forrester gave Elastic the highest possible scores in five criteria: algorithmic trust and explainability, observability as code (OaC) and GitOps alignment, AI stack and semantic observability, sovereign deployment and data isolation, and pricing flexibility and transparency.

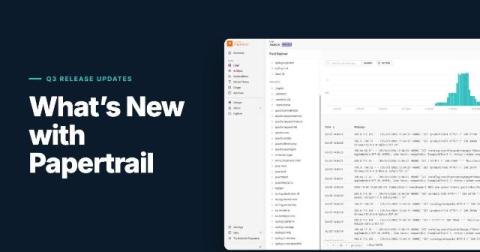
What's new in Papertrail: Q3 2026

Q3 was a big quarter for Papertrail. You can now ask questions about your logs in plain English, explore structured logs by field, inspect any single log event in detail, and archive to your own S3 bucket with a setup that keeps you in control of access. We also shipped a round of smaller improvements that make sending logs and searching them faster and smoother. Here is a quick overview. The two Preview features have their own deep-dive articles, linked below.

Dashboard Library: why some dashboards arrive ticked and others don't

Open the Dashboard Library on a Logs stack that already receives Nginx logs and a few cards come up ticked with a green Data detected badge. Others in the same pack sit there unticked. That isn't random. Before it shows you anything, the Library checks what your stack actually holds and pre-selects only the dashboards it expects to fill.

Setting up Syslog in your Papertrail trial? Here's what to send your admin

Sending server logs to Papertrail over Syslog takes one setup command, and running it needs admin access: sudo on Linux, or Administrator rights on Windows. If you started a free trial but don’t have that access here are instructions to get your logs flowing. Copy your setup command, send it to a teammate who has admin access using one of the ready-made messages below, and your logs can be streaming in Papertrail within minutes of them running the script. This post walks you through those steps.

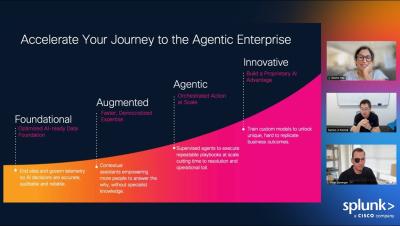
Product Keynote: The Platform for Your Agentic Enterprise

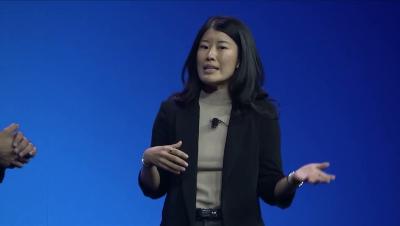
The future of operations is predictive, unified, and AI-powered. Dive into how Splunk and Cisco help organizations unlock cross-domain insights at massive scale, provide intelligent context across security and observability, and build trust in AI with end-to-end visibility. Hear directly from product leaders on the latest innovations shaping agentic enterprises.

Welcome Keynote: Powering the Rise of the Agentic EnterpriseRise of the Agentic Enterprise

Join Jeetu Patel, Head of Product at Cisco, and Kamal Hathi, GM at Splunk, alongside a special guest, to see how organizations transform security, observability, and operations with AI workflows that are proven at scale. Discover how Splunk and Cisco bring unified visibility, trusted AI, and intelligent automation to help organizations.

Should you use a log or a metric?

Since Sentry added Logs and Application Metrics, there are now two ways to record that something happened in your app, and they can look pretty similar: Sentry.logger.info("user.signup") versus Sentry.metrics.count("user.signup"). Both store attributes, both include shared context automatically, and both can be filtered, grouped, and counted. So when you’re instrumenting your code, which one do you reach for?

PHP2Shell: What the Critical PHP Vulnerabilities Mean for Your Servers

TL;DR On October 21, 2026, PHP released emergency patches for two critical flaws known together as PHP2Shell (CVE-2026-109618 and CVE-2026-109619). An attacker with no credentials can use them to run code on a PHP web server, in some cases with a single HTTP request. Upgrade to PHP 8.2.35, 8.3.36, 8.4.27 or 8.5.12 now. Then go through your logs, because exploitation attempts were recorded before the patch shipped. In this post.
Featured Post

Monitoring CloudNativePG: What Changes When the Operator Owns Your Logs

Postgres operators like CloudNativePG (CNPG) have lowered the threshold for running highly available Postgres clusters on Kubernetes. Failover, replicas, backups, and rolling upgrades are handled by the operator, along with helpful niceties like automatic configuration of essential extensions. A few changes to a YAML manifest can provide a lot of value very quickly.

Introducing AI Observability: Trace Every AI Agent Request from Prompt to Pod

TL;DR Logz.io AI Observability provides end-to-end tracing for AI agents and LLM applications. Built on OpenTelemetry, it lets you trace every request from prompt to backend service, visualize multi-step agent execution, isolate root causes across models and infrastructure, and track token usage per step, all alongside your existing logs, metrics, and traces.

Telemetry Cost Management: Routing, Tiering, and Governance Without Blind Spots

TL;DR Cutting telemetry volume is only half of cost management. The other half is sending each signal to the right destination and storage tier, adjusting policies as traffic and incidents change, and rolling out every change in phases that teams can measure and reverse.

Cloud Log Monitoring & Root Cause Analysis | Logs for Lunch

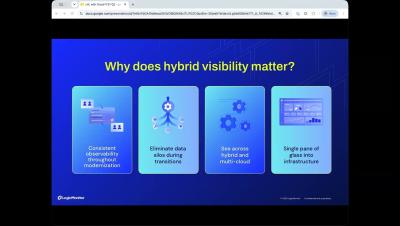
Cloud log monitoring in LogicMonitor connects a service alert to the log event behind it. This Logs for Lunch July demo is for ITOps, CloudOps, and SRE teams. Tom Chavez hosts Ismath Mohideen (Product Marketing) and Nick Doane (Senior Sales Engineer). They cover cloud observability and multi-cloud monitoring across AWS, Azure, GCP, and OCI in LM Envision, using cloud provider APIs with no extra collectors.

LM Logs Tips: Alert-to-Logs Workflow for Ops Team | Logs for Lunch

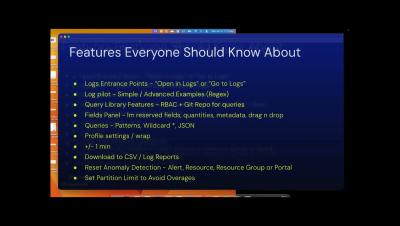
LM Logs troubleshooting starts at the alert. This Logs for Lunch session shows ITOps teams an alert-to-logs workflow and lesser-known LM Logs tips. Ryan Matuszewski demos a Tomcat application error. From the alert's Logs tab, he moves through log anomaly detection, All Logs, Log Patterns, and Log Analysis sorted by sentiment. He then opens the Logs page with the alert time range, and the same steps work for any alert type.

How to View, Filter and Manage Docker Logs Without Losing Them or Filling the Disk

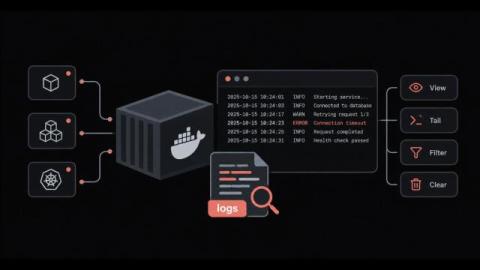
Why does a container fail, restart and leave behind almost nothing useful when you go looking for the cause? Docker logs are the first place most engineers check during an incident, and they work well right up until the output goes missing. Sometimes it is buried under thousands of lines, and sometimes it is deleted along with the container. The docker logs command itself is simple. The difficulty comes from the settings around it, starting with the logging driver and where its files live on disk.

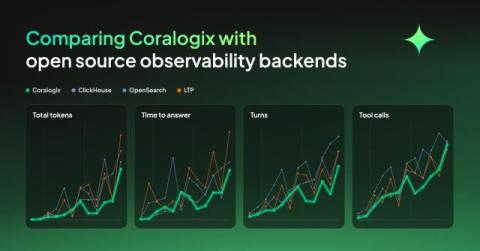
Comparing Coralogix with open source observability backends

We put the same OpenTelemetry data into four backends, Coralogix, ClickHouse, OpenSearch and a Loki, Tempo and Prometheus stack, then set an agent twelve questions against each one, from counting spans to working out what is wrong in a system it has never seen. Then we forced the agents to continue investigating until they got to the right answer. In this experiment, what separated them was the time, tokens, tool calls and turns it took to get there.

CriblCon 26 Keynote highlights: Cribl StreamAI, App Framework, Marketplace, and Detect

This CriblCon 26 keynote highlight reel introduces Cribl’s AI platform for telemetry and highlights Cribl StreamAI, the Cribl App Framework, Cribl Marketplace, and Cribl Detect. It is relevant to IT, security, and observability teams exploring intelligent model routing, agentic app development, marketplace deployment, and security investigations using telemetry and context. The keynote also covers the SEC IT benchmark, the cost of investigating incidents with different AI models, and included inference for Cribl-native workloads.

Centralizing logs: Apache Kafka + OpenSearch

TL;DR Aiven for OpenSearch is where you search logs from every service, with OpenSearch Dashboards included and a built-in integration for Aiven service logs. When several destinations need the same logs, or traffic bursts and mapping changes put logs at risk, put Aiven for Apache Kafka in front: applications write once, Kafka buffers and replays, and sink connectors route logs to OpenSearch, object storage and Aiven for ClickHouse.

Splunk Observability Cloud and Ansible Automation Platform - How to Remediate Alerts with Ansible

Close the AIOps loop with Splunk Observability Cloud and Red Hat Ansible Automation Platform. Explore how OpenTelemetry and Event-Driven Ansible turn alerts into automated fixes, reducing manual firefighting and speeding up incident resolution.

Go, Logs and the Engineering Behind VictoriaLogs Performance

What actually makes a logging system fast? That was the question behind Tech Talk. And if you were expecting the answer to be a collection of clever Go optimizations, Jesús Espino, Principal Engineer at VictoriaMetrics, made an important point pretty early in our conversation: A huge part of VictoriaLogs’ performance comes from architecture and data structures. The micro-optimizations come later. Now that gave my Tech Talk partner in crime, Mathias Palmersheim, and me plenty to dig into.

Best AI Observability Tools of 2026: Monitoring the AI You Build and the AI That Runs Your Ops

TL;DR “AI observability” now describes two different jobs. One is watching the LLM apps and AI agents your team ships: prompts, tool calls, token spend, and output quality. The other is putting AI agents to work on your production telemetry so incidents are already being investigated by the time an engineer logs in. Most engineering orgs in 2026 need both, and very few tools cover the two well.

Introducing Migration Benchmarks: every source we timed now converts in under an hour

The Coralogix migrations team has published what it measured. Since 2023 the team has moved more than 75,000 assets across 300+ migrations and onboardings, including a single migration of about 41,000 alerts. The new Migration Benchmarks page holds the figures by source, a calculator for your own migration and the causes of delay that post-migration reviews name most.

October 2026 at Bindplane: First-class Gateways, three new destinations, and a three-tab Overview

Gateways are now a named resource in Bindplane with their own page, a guided setup, and a one-step migration for anything already running the Bindplane Gateway source. Around that we added destinations for CrowdStrike Falcon Next-Gen SIEM, Arize AX, and Arize Phoenix, gave the Overview page a third tab. Prefer to watch? The October Community Call is streamed live on YouTube. Watch " YouTube" on YouTube Watch.

Logging as a Service (LaaS): What It Costs and When It Fits

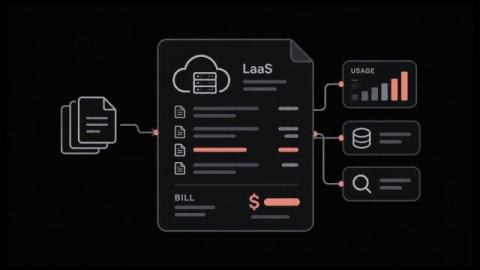
Logging as a Service moves your log management to a provider. They collect, parse, store and search your logs for a monthly fee. The fee is where it goes wrong. Providers meter five different things, and the one written into your contract decides whether ordinary growth doubles your bill. In this blog, you'll see: By the end you'll know which meter your workload lands on. Logging as a Service is a cloud-delivered model for collecting and searching logs.

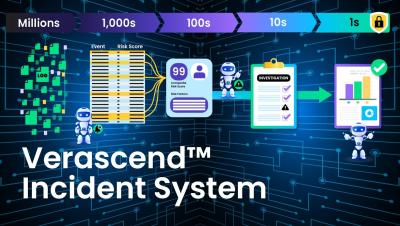
Graylog Verascend Incident System Overview

Verascend Incident System Graylog's agentic layer that turns correlated, risk-scored alerts into verified incidents. Graylog’s Verascend Incident System turns risk-scored alerts into verified incidents before analysts open a case. Alert fatigue is a math problem. Tuning is a workaround. Verascend combines risk-scoring, event consolidation, and two AI agents to confirm which correlated events are real incidents, automatically, before an analyst ever opens a case. Analysts investigate. They don’t filter.

VictoriaLogs Has Now a Long Term Support (LTS) Release

VictoriaLogs now runs in production everywhere, and many teams running it have told us the same thing: everyone wants new features, but it’s hard to keep upgrading their logging backend every few weeks. They want the mix of stability and up-to-date security that only LTS releases can satisfy. We’re happy to announce the first Long Term Support (LTS) release of VictoriaLogs: v1.52.1. This is the start of a new v1.52.x LTS line.

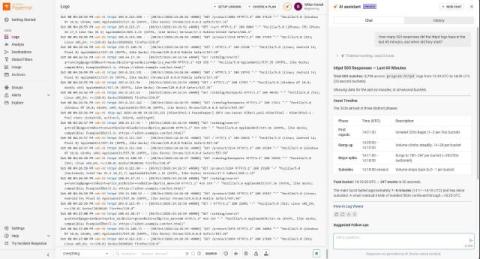
Ask Your Logs: The AI Assistant Comes to Papertrail

It is 2 a.m., and something is wrong. The answer is somewhere in your logs, but finding it means guessing keywords, remembering search syntax, and scrolling through thousands of lines. Your systems keep growing, so you have more data than ever and less clarity when it counts. Today, we are bringing the AI assistant, the SolarWinds in-product AI agent (also known as SW1 in earlier previews), to Papertrail. Ask your logs a question in plain English and get an answer, with a link back to the evidence.

Elastic Introduces Elastic nightshift AI SRE to Investigate with the Full Context Others Can't Afford to Keep

The AI SRE uses complete context from across the entire stack to continuously detect issues and learn from every incident, delivering evidence-backed answers engineers can trust.

10 Best AI Logging Tools in 2026: Features, Pricing & Comparison

As businesses increasingly integrate artificial intelligence into their applications and workflows, understanding what happens behind the scenes of these AI systems has become essential. AI-powered chatbots, large language models (LLMs), and autonomous AI agents can process thousands of requests, interact with external applications, and execute complex tasks. However, when something goes wrong, identifying the source of the problem isn’t always straightforward. Was the AI response incorrect?

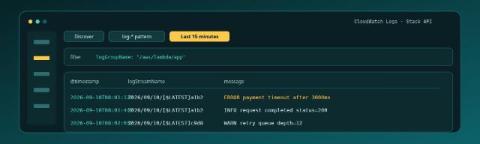
First CloudWatch Logs on Logit.io

CloudWatch already holds the lines from your Lambda, ECS task, or unified agent. The first useful win on Logit.io is not a migration spreadsheet. It is one Log Group, the documented Lambda shipper posting to this stack's API, and rows in OpenSearch Dashboards Discover that show logGroupName, logStreamName, and message. If you are still proving that a Logs stack can accept anything at all, start with First Logs on Logit.io; this post assumes CloudWatch is the source and the Stack API is the pipe. Contents.

Debug Production at the Speed of AI

Your coding agent can debug production issues now. Yes… Not just “help you debug.” Actually run the investigation… FOR YOU! In this new era of agentic development, speed matters. And in the old days (you know… last week or so) we used to investigate production bugs ourselves. Manually. Like humans. But for a lot of incidents, we don’t need to do all of that anymore.

Where Jev fits in ops

If you're using agents and MCPs to get a better understanding of your environment or work through an investigation, you can get a lot of useful information back. You can pull logs, look at recent changes, and check how services are configured, but you're still the one deciding what to do with all of it. That part of the process still lives in your head. To see where Jev might fit, look at decisions your team already makes and work backwards from them.

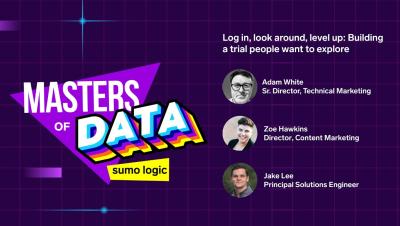
Log in, look around, level up: Building a trial people want to explore

We turned the mic around for this episode, with Zoe Hawkins interviewing Adam White and Jake Lee about Sumo Logic’s redesigned free trial. The new 14-day sandbox comes preloaded with realistic data feeds, Cloud SIEM, and our AI agents, so no one has to build collectors or open tickets before finding out whether the platform fits. Adam and Jake walk through the guided “choose your own adventure” paths, the broad, open-ended questions that bring out the best in Mobot, and how the trial will keep pace with new releases.

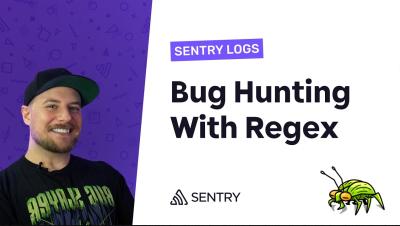
Searching Sentry Logs with Regex

We use Sentry's new Regex search for Logs to hunt for non-obvious bugs in our app. What do you do when traces show that Postgres jobs are backing up? Logs are trace-connected, so by looking at one of the affected traces, we can see all of the logs on that trace. In there, we can see Postgres has logged that it acquired a lock only after a long wait. Using regex, we can find all of these logs that describe acquiring a lock after a 10-second-plus wait. That narrows our search from thousands or hundreds of logs down to about a dozen.

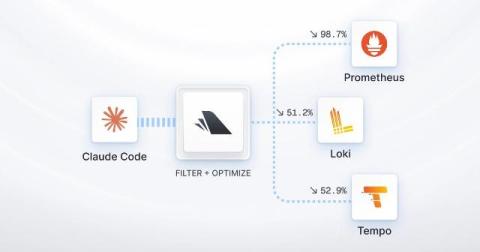
How to Filter and Reduce AI Agent Telemetry with OpenTelemetry & Bindplane

Why is the telemetry AI agents generate so intimidating? If you turn on Claude Code’s internal telemetry it’ll throw a wall of text at you. And, it’s very expensive to store. But, the bigger issue is that you can’t make sense of it. Luckily it’s all OpenTelemetry native. That means you can configure it to send, transform, and store what you really need. Which raises the only question that matters. What do you actually need?

Steer, Block and Audit Agent Behavior from One Place | SAO Agent Control Demo Cisco Agent Control

Most teams keep an agent from regressing by hardcoding checks into its logic, an if-statement here, a regex there. Every new rule then becomes a code change, a review, and a deploy, and the person who spots the problem in production is rarely the person who can ship the fix. Agent Control moves those rules out of the code and into one hub. Steer, block, and validate agent behavior in real time, with rules any team member can update without touching the codebase.

Turn Production Failures Into Test Datasets | SAO Dataset Curation

Your agent breaks in production. You fix it and move on. But the input that actually broke it is gone and two months later the same failure quietly comes back, because there was never anything to test against. That's not a debugging problem. It's a missing dataset. This demo turns low-scoring production traces into a regression suite you can run against every prompt and model change, without writing a single test case by hand.

Block AI Agent Regressions Before They Ship | SAO Pre-Push Eval Gate Demo

Every engineering team has unit tests. They tell you the code still works. They tell you nothing about what the model started saying. This demo wires a single eval gate script into a git pre-push hook, so Splunk Agent Observability scores every agent's output before the push is allowed through. Luna, an on-premise small language model, runs as a synchronous judge against fixed thresholds. Fail one, and the push is blocked.

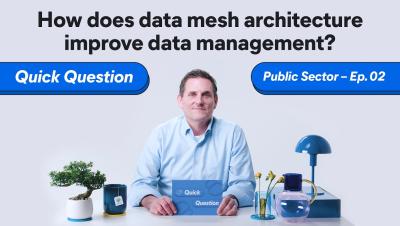
How does data mesh architecture improve data management? [Quick Question Ep. 2]

How does data mesh architecture improve data management? In this episode of Quick Question, we cover the three core benefits — real-time visibility, control, and data quality — including how CISA uses Elastic to connect data from over 100 civilian agencies without moving it to a central location. The episode also covers how data sovereignty is preserved through role-based and attribute-based access controls, and why data quality improves when the teams closest to the data are the ones managing it.