The latest News and Information on Log Management, Log Analytics and related technologies.
When you migrated critical infrastructure to the cloud, what were your goals and expectations? Odds are, you hoped leaving on-premises infrastructure would produce significant organizational benefits. You probably figured you’d streamline operations and reduce management overhead. You felt you’d have an easier time meeting business goals. Perhaps most important of all, you likely expected your environment would become less complex, and even cost less to operate.
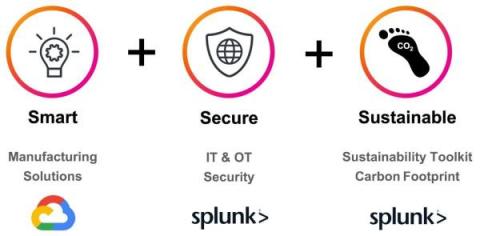
* Co-author: Alexander Okl, Sr. Partner Development Manager EMEA | Google Cloud at Splunk “The way we look at manufacturing is this: the strategy should be to skate where the puck is going, not where it is.” - Tim Cook, CEO, Apple Inc.* So where is the puck going for manufacturers in 2022 and beyond?
Monitoring is a fundamental pillar of modern software development. With the advent of modern software architectures like microservices, the demand for high-performance monitoring and alerting shifted from useful to mandatory. Combine this with an average outage cost of $5,600 per minute, and you’ve got a compelling case for investing in your monitoring capability.
For the last five years, Logz.io has tracked and measured the pulse of DevOps, as well as adoption of key trends and technology, through our DevOps Pulse survey and report. One of the obvious focus areas for us, as a company whose products are based on industry-leading open source, is the increased rise of incredibly useful open-source observability solutions, in general.
The second in our Feature Highlights webinar series, Protect the Business with Cribl Packs, highlights Packs and security use cases. Packs enable you to share complex Stream/Edge configurations across multiple Worker Groups/Fleets, between Stream/Edge deployments or with the Cribl Community. Packs roll up best practices to ensure Site Reliability Engineering (SRE) teams have the required data to protect the business.
Splunk builds innovative tools which enable users, their teams, and their customers to gather millions of data points per second from an ever-growing number of sources. Together, Splunk helps users leverage that data to deliver, monitor, improve, and secure systems, networks, data, products, and customers with industry-leading solutions and expertise.
As more organizations adopt cloud-native technologies and microservices-based architectures, application troubleshooting is becoming increasingly complex. With so many moving parts in an environment that is both dynamic and distributed, it is difficult to get the full picture. Yet complete visibility is crucial in order to find and fix issues quickly — especially ones that impact the bottom line.
Elastic Enterprise Search 8.2 introduces new ways to ingest, search, and monitor data, giving developers the productivity benefits of using out-of-the-box capabilities along with the power and flexibility inherent in Elastic Stack tools. Operators also gain even more transparency for managing search experiences and observing search performance. For a visual walkthrough of some of the key capabilities in 8.2, check out the latest installment of What’s new in Enterprise Search on YouTube.