Operations | Monitoring | ITSM | DevOps | Cloud

MSP Marketing: Should you build an in-house team or use an outside agency?

You have made the decision to finally start taking the marketing and lead gen activities of your MSP a bit more seriously, but, as the business owner, you recognize that you don’t have the time or energy to take this initiative on yourself. So, what do you do? Do you decide to hire internally and build your MSP marketing department from the ground up? Or do you decide to outsource the marketing function to a third-party agency and have them manage it all for you?


Trunk Based Development

When you have a lot of software developers working on the same project, keeping track of individual changes and previous versions is crucial, especially when it helps prevent conflicts that slow the development and deployment process. For most development teams across the world, Git is the system of choice for organizing files and versions of software.

Examples of SLA Templates in IT Service Management

Remember when you raised a service request and received a delayed solution? The response was so late that you switched to looking for another possible solution. Such delays impact the organization’s overall progress, and we are sure you don’t want to encounter them frequently. This is where Service Level Agreement (SLA) comes to shield organizations from such irregularities.

We're increasing the default cron jitter from 5 to 20 minutes

At Upsun, we are committed to making your site perform as best as possible. As part of this commitment, we need to smooth down the system load spikes as much as possible—especially when many crons are triggered at the same time on a particular Grid region. To do so, we are increasing the default cron jitter from five minutes to 20 minutes.

How to Troubleshoot Amplify APIs

One of the things we love about working in the cloud is the ease and scalability it brings to application development. It enables us to build out applications, APIs and any infrastructure that is needed from prototyping an idea, through to self scaling deployments. Monitoring and troubleshooting production-level serverless applications is always tricky, Especially working across a number of services and the many logs they can produce.

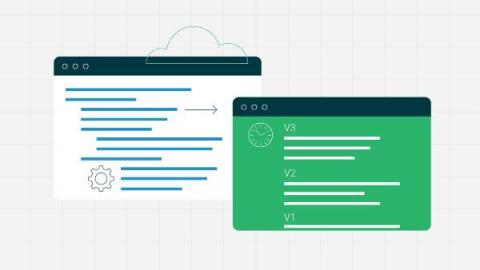
Add traceability to your pipeline with Configuration as Code

Configuring applications, services, and environments by modifying plain text files is a standard part of modern software development. Configuration as Code (CaC) takes this one step further by systematically generating, storing, and managing configuration files. CaC allows development teams to automate config management for their applications and environments while ensuring consistency and traceability throughout the development life cycle.

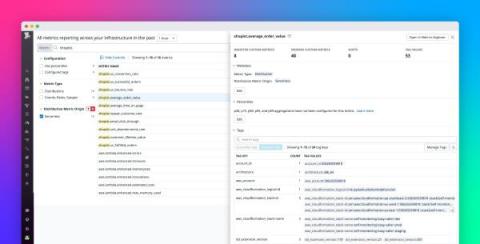
Monitor custom serverless metrics with the Datadog Lambda extension

When building serverless applications on AWS Lambda, Amazon CloudWatch provides out-of-the-box metrics that measure the performance, errors, and duration of your functions. Although these standard Lambda metrics provide visibility into your serverless applications, it can also be invaluable to monitor custom metrics that are unique to your use case and application.

Kafka Security - First Steps

Apache Kafka provides an unified, high-throughput, low-latency platform for handling real-time data feeds. Installing Apache Kafka, especially the right configuration of Kafka Security including authentication and encryption is kind of a challenge. This should give a brief summary about our experience and lessons learned when trying to install and configure Apache Kafka, the right way.

Icinga DB Web: Combined permission and restriction management

Last week we released the final first version of Icinga DB and its web interface module Icinga DB Web. Icinga DB Web offers many new features and a completely new design. The monitoring module has its limitations when managing a role, as it handles permissions and restrictions separately. This means that the permissions for a role are not related to the restrictions of the role To understand this better, here is an example.

Continuous Profiling: A New Observability Signal

We’ve all grown used to logs, metrics and traces serving as the “three pillars of observability.” And indeed they are very important telemetry signals. But are they indeed the sum of the observability game? Not at all. In fact, one of the key trends in observability is moving beyond the ‘three pillars: One emerging telemetry type shows a particularly interesting potential for observability: Continuous Profiling.