
Operations | Monitoring | ITSM | DevOps | Cloud

The End Of Cloud-First: What's Driving The Shift To Hybrid Infrastructure

For more than a decade, the prevailing wisdom in enterprise IT was simple: move everything to the public cloud. Hyperscale platforms promised unlimited scalability, lower costs, agility and freedom from the burdens of managing infrastructure. Cloud-first has been rapidly gaining momentum as the de facto path to a modern digital footprint. Until now.
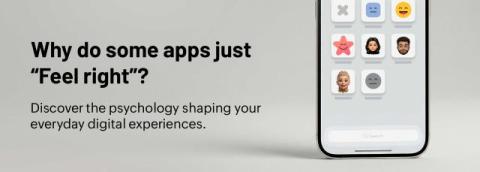
The psychology behind the apps we use every day

Have you ever opened a new app and immediately known what to do? You know where to click, what an icon means, and somehow everything feels exactly where it should be. Then you open another app and spend several minutes looking for a basic setting, navigating confusing menus and wondering why something so simple feels so difficult. What makes the difference? It isn't always the technology. Often, it's psychology.

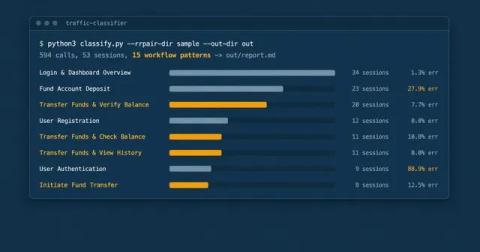
I built an API traffic classifier for business workflows

An engineering leader asked me a question a few weeks ago: could we read their business workflows out of API traffic instead of asking people to document them? I said it should be possible. Then I tried it. A few engineers know how the system really works. They know which calls make up a work order and which checks happen after a write. That stuff rarely makes it into the test plan. Usually it’s in somebody’s head. Sometimes it’s in several heads, with slightly different answers.

Zero-Code Instrumentation in Kubernetes Without the Instrumentation CRD

The OpenTelemetry Operator changed how teams approach telemetry collection in Kubernetes. The core appeal of zero-code instrumentation is that you can bring up telemetry inside application containers to collect traces, metrics, and logs without touching your source code or rebuilding your container images. However, if you follow the default OpenTelemetry Operator documentation, you quickly run into a heavy operational prerequisite: the Instrumentation CRD.

Shipped: Cost alerts in the Google Chat space where your team already works

If your company runs on Google Workspace, your team lives in Google Chat. That is where the standup happens and where threads turn into decisions. Cost alerts can now go there too. This is relevant because an alert only does something if it reaches people in a place where they can talk about it. Email is great for a record but not great for a reaction. An anomaly notification sitting in an inbox waits for that person to open it, decide it is real, and then go tell everybody else.

The AI trust dial: from local agents to autonomous software factory

There are many conversations about the use of AI, particularly how engineering teams are using it in their coding workflows. Manual work is being replaced by agent-driven automation, and human value increasingly lies in the higher-order work: writing specs, thinking through architecture, steering the direction, exercising taste, and reviewing the output.

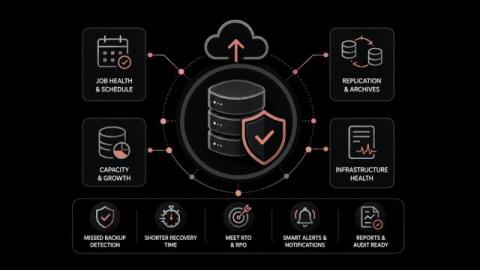
What Backup Monitoring Software Should Track to Protect RTO and RPO

How many backup jobs completed successfully in your environment last night, and how many of those systems could you bring back inside the window the business agreed to? Most backup consoles answer the first question well. They report job status, completion time and volume written, then roll it into a reassuring compliance summary. The second question needs different evidence, usually missing from that screen. The distance between those answers shows up during the recovery attempt.

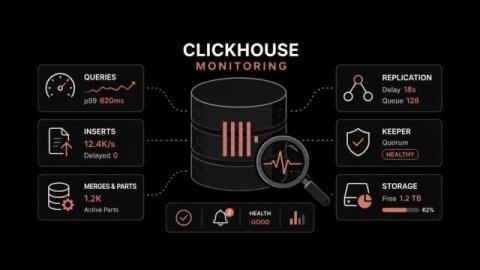
A Practical ClickHouse Monitoring Guide Built Around Failure Modes

Why does a ClickHouse cluster report every node as healthy while inserts start failing and dashboards go stale? Most often the failing subsystem was never represented in the metrics anyone had on screen. A node answers its health check while its replication queue has been growing for hours. ClickHouse breaks in specific, repeatable ways. Parts accumulate faster than background merges can consolidate them. Coordination drops quorum and every replicated table quietly turns read-only.

The Grafana AI SDK for Go: a shared foundation for building AI applications

Starting an experiment with an LLM has never been easier. Keeping a growing collection of those experiments consistent is another matter. Earlier this year, as more teams began exploring AI features here at Grafana Labs, we repeatedly encountered the same pattern: a new experiment would start, move quickly, and build its own client for whichever model provider it needed. The next experiment would do the same, with a slightly different abstraction for streaming, tools, errors, or provider configuration.

What to Look for in Code Review Platforms

Your code review tool does more than display diffs. It shapes how your team shares knowledge, catches bugs, and ships software. With AI-generated code accelerating PR volume, choosing the right code review platform is a decision that directly affects your team’s velocity. GitKraken connects PR workflows, multi-repo management, and AI-assisted review into a single developer experience platform.