Operations | Monitoring | ITSM | DevOps | Cloud

The latest News and Information on DevOps, CI/CD, Automation and related technologies.

Deploying Kubeflow everywhere: desktop, edge, and IoT devices

Kubeflow, the ML toolkit on K8s, now fits on your desktop and edge devices! 🚀 Kubeflow provides the cloud-native interface between Kubernetes and data science tools: libraries, frameworks, pipelines, and notebooks. > Read more about what is Kubeflow To make Kubeflow the standard cloud-native tool for MLOps within the AI landscape, the open-source community has accomplished the aggregation and integration of many projects on top of Kubernetes.

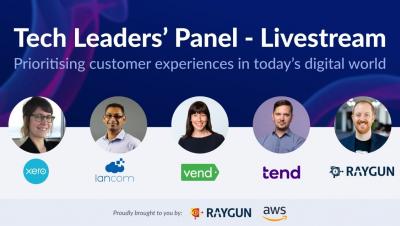
Tech Leaders' Panel - Prioritizing Customer Experience in Today's Digital World (Livestream)

In today’s digital world, leading companies are having to redefine what it means to deliver a flawless experience for their customers. In this exclusive panel discussion, learn how software teams at Vend, Xero, Tend Health and Lancom put the customer experience at the centre of their development workflow, closing the feedback loop between code and customer.

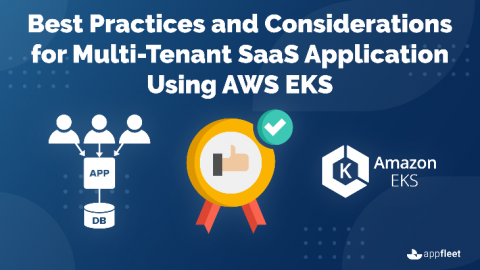
Best Practices and Considerations for Multi-Tenant SaaS Application Using AWS EKS

Today, most organizations, large or small, are hosting their SaaS application on the cloud using multi-tenant architecture. There are multiple reasons for this, but the most simple and straightforward reasons are cost and scalability. In a multi-tenant architecture, one instance of a software application is shared by multiple tenants (clients).

Grafana vs Chronograf: Pricing

Grafana vs InfluxDB – Both offer their cloud services for storing, visualizing and alerting on any kind of time-series data. Both cloud offerings differ from each other in various ways and follow distinct pricing strategies. In this article, we cover the details of Grafana as a service and InfluxDB Cloud, their features and benefits along with their pricing models. MetricFire is a Hosted Grafana service, where you can use Grafana dashboards directly in the MetricFire platform.

Sending metrics to MetricFire

Monitoring IT resources is part of the daily activities in large and medium-sized companies, but smaller companies also benefit from the advantages of monitoring systems, memory capacity, availability, and performance. The aim of such proactivity is to ensure smooth processes - for example, IT administrators need to know days in advance that disk space is becoming too low, so they can do something about it.

Keep Watch on Docker Hub Pulls with JFrog Log Analytics

Have you heard? Docker Hub now limits usage by free anonymous and credentialed accounts. After the number of pulls from an IP address exceeds a fixed threshold within a six hour period (100 for anonymous, 200 for credentialed), Docker Hub throttles bandwidth. You’ll still get your Docker images, but at a much slower speed. You can read our earlier blog post to learn more about the Docker Hub policy changes.

Docker: Secure, but comfortable images.

While developing Docker images for Icinga 2, Icinga Web 2 and Icinga DB we stumbled over OpenShift which doesn’t allow images to run as root by default. One has to enable that explicitly. Also admins of K8s environments being more permissive by default may decide not to allow running as the superuser. So we’ve added a USER directive to our Dockerfiles to make our customers‘ compliance departments happy.

How Our Roots in Observability Set Us up To Calculate Cost per Tenant on AWS

It’s safe to say that cost per tenant (also known as cost per customer) on AWS has been a challenging metric to obtain. Until now, your best bet has usually been to either make a best guess or build some sort of homegrown system. As of November 4, 2020, when you google “cost per tenant,” you get a few things at the top of the page. The first is a couple of blogs by AWS, where they describe an extraordinarily complex system, which you can build yourself.