Alerting in Grafana 9
For more info, go to:
Grafana Alerting page: https://grafana.com/grafana/grafana-alerting/
Grafana Alerting documentation: https://grafana.com/docs/grafana/latest/alerting/

For more info, go to:
Grafana Alerting page: https://grafana.com/grafana/grafana-alerting/
Grafana Alerting documentation: https://grafana.com/docs/grafana/latest/alerting/
For more info, go to:
Grafana Alerting page: https://grafana.com/grafana/grafana-alerting/
Grafana Alerting documentation: https://grafana.com/docs/grafana/latest/alerting/
For more info, go to:
Grafana Alerting page: https://grafana.com/grafana/grafana-alerting/
Grafana Alerting documentation: https://grafana.com/docs/grafana/latest/alerting/
We’re excited to announce that we’ve just released SquaredUp Dashboard Server 5.6! This Dashboard Server release covers multiple features that have been highly requested by the community. Prioritizing this user feedback, we’ve added some exciting new visualizations, features and enhancements. Read on to learn about the latest updates, or catch the full webinar recording at the bottom of the blog for a detailed demo by Senior Solutions Engineer Ashley Thompson.
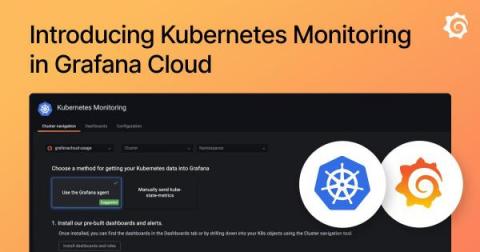
Kubernetes has quickly become the standard container orchestration technology for developers and companies who want to deploy at scale, iterate quickly, and manage a large number of applications and services. At Grafana Labs, we recognized the need for something more powerful for our users to be able to successfully keep an eye on everything happening inside their clusters.
A few months ago, I wrote about using the Sqlyze data source plugin in Grafana to query COVID-19 wastewater surveillance data on Databricks. Did you know that with the Sqlyze Enterprise plugin, you can also access REST APIs (web services), treat them as database tables, and query them using SQL? You can use any ODBC driver you like, and it’s not limited to relational databases, either. You can query NoSQL and document databases, too.
The entire team at Grafana Labs is thrilled to bring the community our latest and greatest release, Grafana 9, which we introduced at GrafanaCONline this year. In addition to introducing the Grafana Loki query builder, a new command palette, and making role-based access control GA, we also rolled out major updates to the navigation and search functionality in Grafana with the aim of continuing to support the community and users throughout their observability journey.
In 2019, Polar Signals Founder and CEO Frederic Branczyk predicted that continuous profiling would be the future of observability. Today, he’s making that future a reality with his open source continuous profiling tool, Parca. In this episode of “Grafana’s Big Tent” podcast, our hosts Matt Toback and Tom Wilkie chatted with Frederic about how he got his start in the continuous profiling world and how he’s built an active open source community around Parca.
I recently changed teams within Grafana and now I get the chance to work with Grafana Loki, our highly effective open source log aggregation system that stores and queries logs from your infrastructure or applications. At Grafana, we always dogfood our products so what better way to learn more about Loki than trying out a simple use case that I can actually benefit from.