Dashboards

Grafana 5.4.4 and 6.1.6 released with important security fix

Today we are releasing Grafana 5.4.4 and 6.1.5. These patch releases include an important security fix for all Grafana installations between 5.4.0 and 6.1.6. Grafana installs between 6.0.0 and 6.1.4 are less vulnerable due to other security improvements. These versions are only vulnerable if the administrator has disabled default security settings.

How to Visualize Data that Really Matters to Business with Grafana and MySQL

So you have a Grafana dashboard that shows failures at 0.01% and that latency is down throughout the company. But rather than get a pat on the back, “your boss’s boss is saying cut the crap or stop the mumbo jumbo. What does it really mean for our business?” said Peter Zaitsev, CEO of Percona, which offers solutions such as support, management services, consultant training, and custom engineering for MySQL, MariaDB, MongoDB, Postgres and other open source databases.

How Bloomberg Tracks Hundreds of Billions of Data Points Daily with MetricTank and Grafana

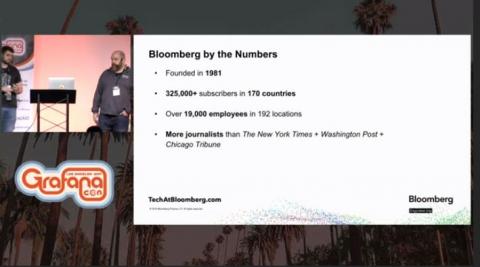
Bloomberg is best known as a media company with its news destination site, its award-winning magazine Bloomberg Businessweek, and its daily 24-7 social media program, Tic Toc, on Twitter. But the main product for the 38-year-old company is actually Bloomberg Terminal, a software system that aggregates real-time market data and delivers financial news to more than 325,000 subscribers around the world.

Grafana Plugin Tutorial: Polystat Panel (Part 2)

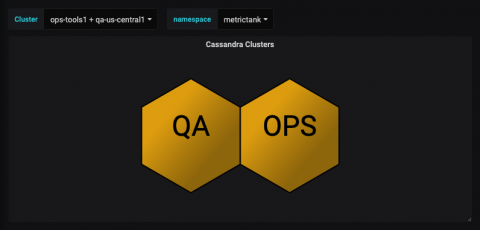
At the end of Part 1, the end result was a set of polygons that represented each Cassandra node in a Kubernetes statefulset. The cAdvisor-based metrics CPU/Memory/Disk utilization are scraped by Prometheus. This second tutorial will focus on a rollup of multiple Cassandra clusters running inside Kubernetes. We will end up with three dashboards tied together to provide an overview of our Cassandra clusters.

Automating Building the Grafana Image on DigitalOcean with Packer

I recently gave a talk at DigitalOcean Tide in Bangalore on “Grafana and the DigitalOcean Marketplace.” The DO Marketplace lets you launch a range of open source software, including Grafana, with just a few clicks. This post is not about the marketplace – I’m going to talk about how we automated the building of the images.

Coming Soon: Seamless and Cost-Effective Meta Tags for Metrictank

One of the major projects we’re working on for Metrictank – our large scale Graphite solution – is the meta tags feature, which we started last year and are targeting to release in a few months. A lot of people don’t realize this, but Graphite has had tag support for more than a year. Our mission with Metrictank is to provide a more scalable version of Graphite, so introducing meta tags was a logical next step.

How eBay Moved from Custom UIs to Grafana Plugins

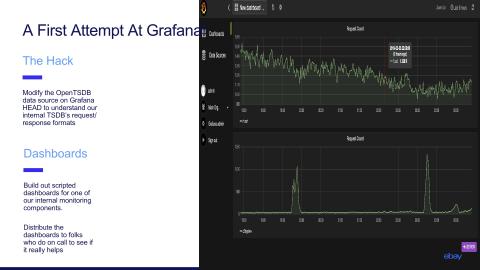
In the beginning, the mission of the logging and monitoring team at eBay was simple: “to give out APIs that the developers in the company could use to instrument their applications [in order] to send logs,” Vijay Samuel said during his talk at GrafanaCon about eBay’s journey to using Grafana plugins. “We had our own developers who built out UIs for being able to search view and debug their issues. And metrics were no different from logs.

A Look at the Latest Cloud Data Source Plugins in Grafana

The engineers at Grafana Labs have their heads in the clouds. “This is a new world: We have hybrid clouds and multiclouds,” Daniel Lee told the crowd gathered at GrafanaCon 2019 in Los Angeles. And the advantage clients have when using Grafana’s hosted services is that “they can deploy them on any cloud,” said Lee.